Dear Fekadu
Good job,keep it up!
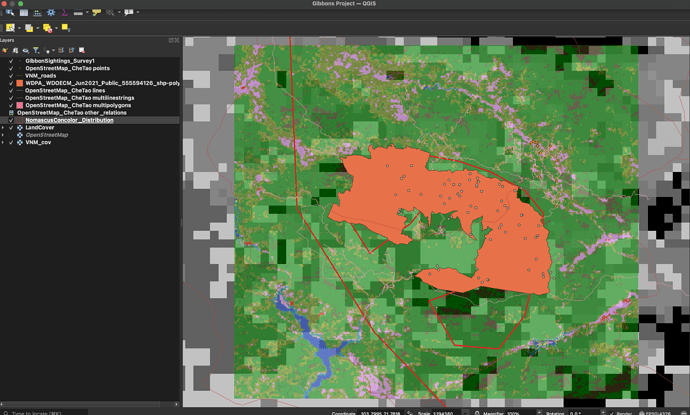
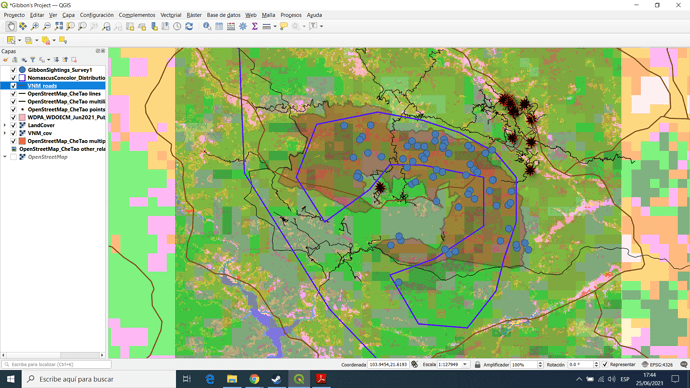
I am not entirely sure that I did this module correctly but either way I still did learn what the difference between the layers were as well as what each is used for which was very beneficial. Like some others in the group I had various difficulties with this module on my Mac. There were many more files to use this time compared to the previous module and I was not sure which ones to use as my Mac downloaded all the files. Next time I will try and be more careful with what files are downloaded so it does not get so messy.
Hi @Athenkosi. Yes it was a little confusing for me too dealing with all the different layers. I noticed that you have the DCW Landcover layer (VNM_cov) at the top. That will be covering all the other layers. If you move that down to either the lowest, or 2nd lowest above OpenStreetMap, then that will allow you to see the rest of the layers.
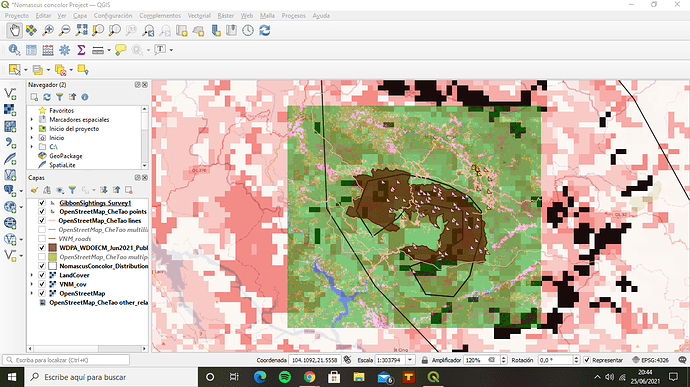
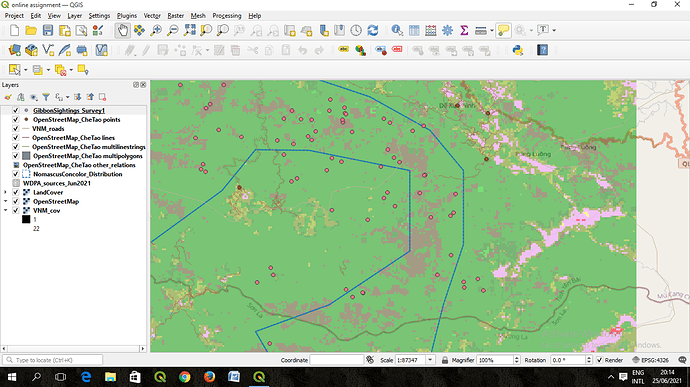
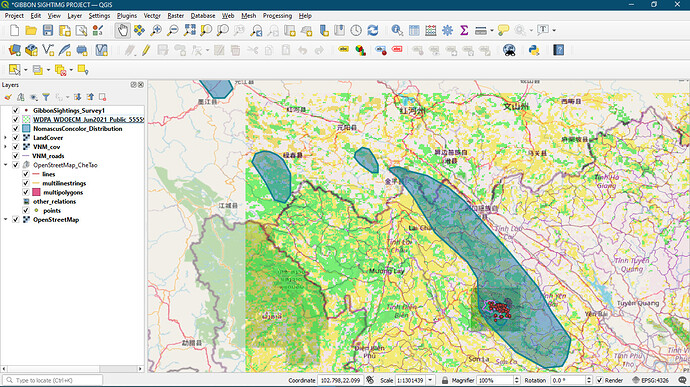
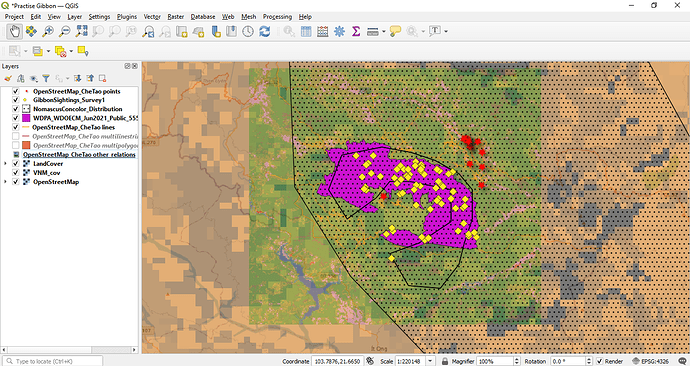
Thanks @Sianes , I didnt know that you could change the shape of the points until I saw your screenshot. That helped me to do the same and more easily differentiate between the 2 sets of point data.
The explanations in this module about vector and raster data were very interesting, and the examples of each one highly illustrative and helped settle the differences in my mind. Also, being able to compare data of different resolution was something new and especially interesting as well. I had some trouble selecting a proper symbology for my layers; apart from that, the instructions were very clear and easy to follow.
Hello! I think your work is just fine. Maybe you could try moving some layers up or down. For example, moving the “NormascusConcolor_Distribution” layer somewhat up, above the “VNM_cov” layer or so, could help you visualize it in your map. I don’t have a mac, so I don’t know why you had these problems but hope this tip’s helpful!
Welldone! Keep it up . I love the Outlook of your work.
This module look rather complicated to me. I encountered a lot of problems why trying to get the project done. Though I was able to solve some of them myself.
I’m looking forward to learning more and get better at it.
Irene, I like your work.
well im able to apply the same principle on my study area. im greatful of this app.
Happy with my progress.
Nice outline, right to the point.
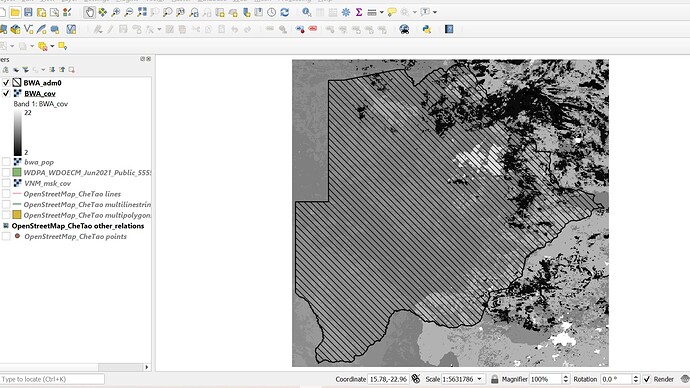
This module helped me to differentiate between vector data and raster data, it also allowed me to define well which of the two data formats best suits my work.
your map looks awsome
This module taught me the differences between raster and vector data. It was interesting changing properties of various layers. Though managing the layers to view all layers at the same time was difficult, I was able to overcome it by changing symbology of various layers. Also, discussion on extent and resolution -both temporal and spatial, was very illuminating.
Hi Klein, deciding on what to represent as raster or vector depends on the purpose of the investigation and methods used. Vector is anything with definite co-ordinate (point), joining two or more points will form line, and lines with the beginning and ending joining refer to polygon. While raster are data with arbitrary shape, i.e it is difficult to ascertain where exact points where changes occur. For example, to represent a house on a map, one has to take the definite co-ordinate of all the corners of the house; such a data is a vector(polygon). While vegetation cover data will be raster because there is no the exact point where forest changes to Savannah, grassland to say desert; such information will be determined arbitrarily.
ARRRRR I see thank you. I was pretty confused, I more of a visual person. So if i’m new to something and i’m just reading instructions I can get a bit lost sometimes.
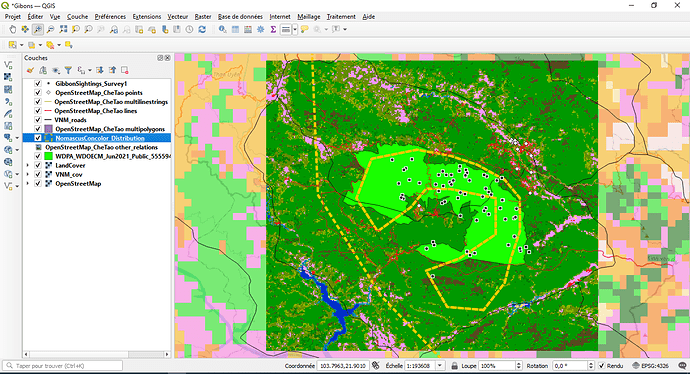
Yes I went for colours that would enable you to see each layer well as it was a very busy map with everything competing. a cartographer would probably think it was a hot mess. I did do a cartography course with MOOC, I did not follow the rules fort this ahaha.
Deleece
ooooo you colour blended well, not too loud like mine was ahaha
defiantly have ago at re-adjusting the sequence in your layers panel. This orders it as it appears in the map. I have no idea what the rules of thumb is but i sort of went points, lines, polygons, rasters. Your rasters being midway up make them very prominent and you loose site of the data, try them at the bottom  .
.
In this module, I have learned some vocabularies and more understand about difference between raster and vector. But in Q_Gis project, I don’t know where the layout “OpenStreetMap_CheTao other_relations” comes from (I don’t remember importing this one), and what is it’s function?
This module helps me to see the difference between the types of layers. Having played around with the properties of each layer, I managed to set different transparency to different layers and overlay all of them together for easier comparison. This gives me an idea on how to present my own set of data in future.
