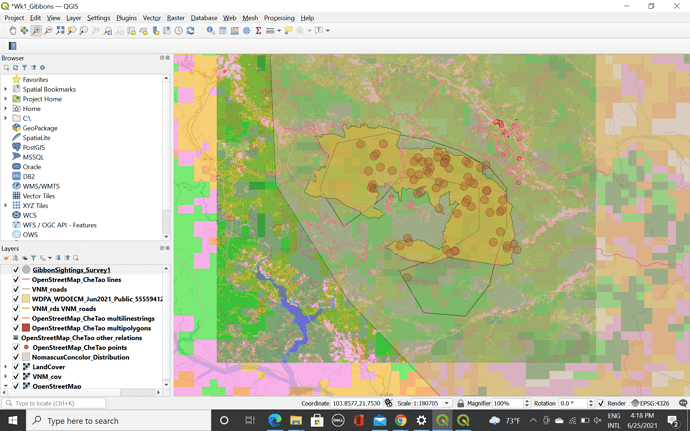
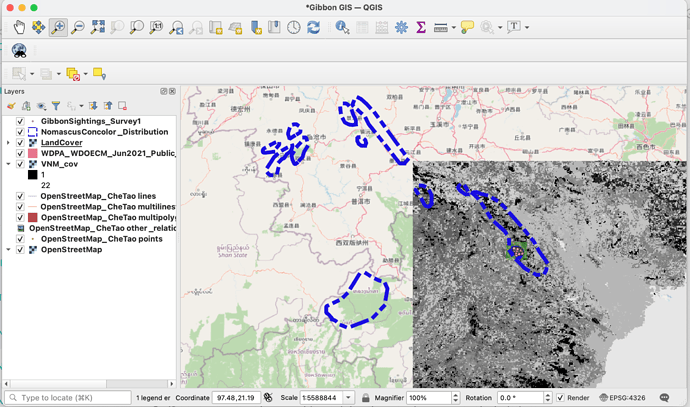
No I have not tried the group option because I confuse how to use it
Thank You! Yes, I have used the gradient fill function. Just wanted to try something new.
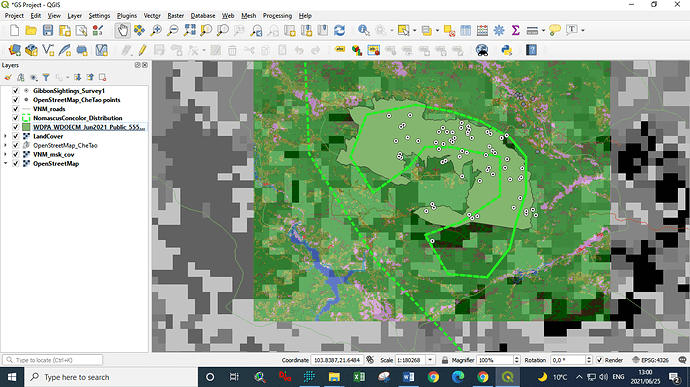
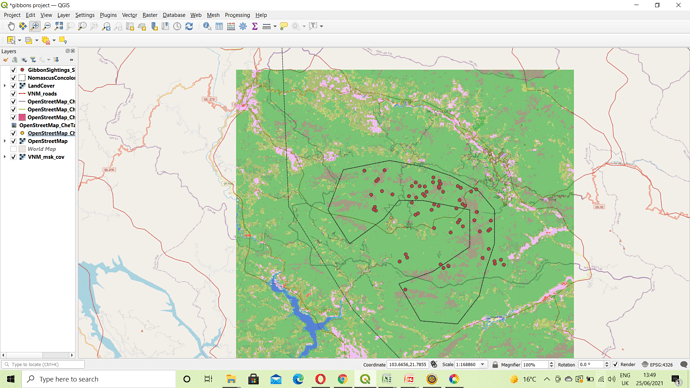
Module 2 was a bit more challenging due to the difficulties I had in uploading the different data for each layer. However, after checking the chat and trial and error (sometimes I could not upload the data due to an error message in red), I managed to get all the layers uploaded and got to toggle between coarse and large extent data (IUCN NomasusConcolorDist) with fine grain, small extent data (Che Tae Nature Reserve Boundaries), and compare the coarse grain, worldwide extent of Open Street Maps - OSM) with the DIgital Chart of the World (DCW) fine grain, only in Vietnam roads. This makes me think that when making my own maps, I can have them less “data heavy” by adding country or even city specific layers instead of the whole Open Street Map (OSM) into a smaller extent map. I also got to toggle between large sized pixels of the Digital Chart of the World (DCW) Vietnam land cover classes, which have coarse grained, large extent - all of Vietnam versus the Copernicus land cover raster, which has small pixels, is fine grained and cover only the Che Tao Nature Reserve. The difference in scale in these last two comparisons show me that DCW isn’t always fine grained compared to other data sources.
In future maps, I would like to choose which layer to keep, for best telling the story I want to tell with my map, since in the screen shot I took, I kept all layers in the final map.
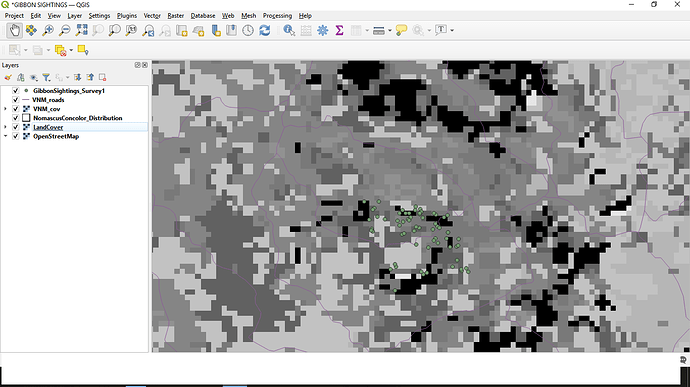
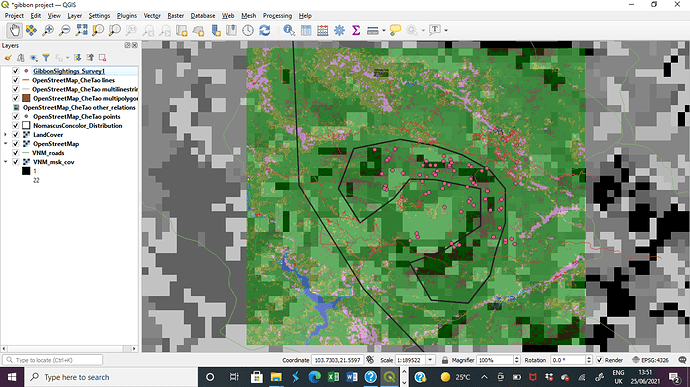
I looked at the other students’ screenshots just now and wondering why they have black and white rasters for DCW land cover classes for Vietnam while mine are brightly colored; I did not change anything with the Symbology under Properties.
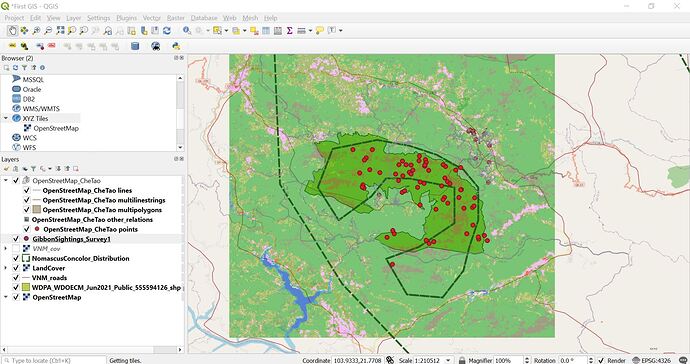
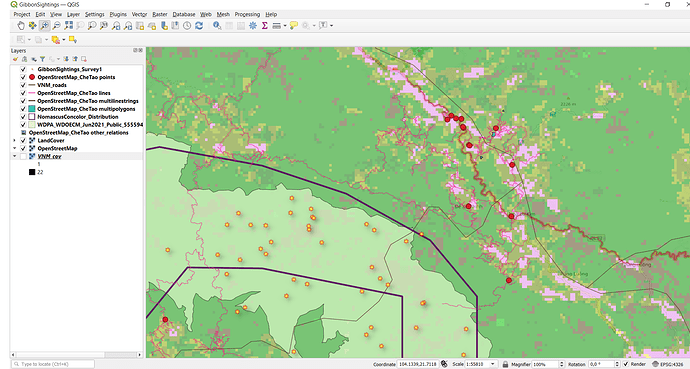
I like how you changed the Symbology of the Che Tao Nature Reserve to red lines so we can easily differentiate it from the IUCN NomasusConcolorDistribution layer. I also liked how you made the size of the gibbon sightings smaller circles so you could see them better inside the nature reserve.
I able to follow the instruction and this is how my maps look like. I have adjusted the size of gibbonsighting_survey1 circle to smaller size, so it doesn’t look so big and occupy so much of space in map. Just have one question to clarify, how do we specify the arrangement of the layers? What i know is putting OpenStreetMap as last layers, so everything can mask over it
hello guys
Here is my work. I am failing to understand the instructions on how to add the new data sets (resolution and extent). It was all fun until I got lost. Can someone help, thank you.
Vuyisile
Hie,
You seem to have been able to add more than I did, Congratulations! I am also having problems understanding what I am doing or required to do. Hope we find help though.
Vuyisile
Okay this module was very helpful on refreshing my understanding between the vector and raster models and their properties. Which helped to better visualize the data at hand and to rearrange the layers to get a better presentation and relevant data visible.
This is the best I could do. I do not know if I have done everything accordingly.
Please assist.
In this Module I tried to grasp the difference between vector and raster.
I had no problem following the instructions. I only stopped at the third point when it was necessary to enter the VNM_cov.qml file in QGIS. I tried by directly copying it into the program, then I tried by using “Add Layer”, both vector and raster, even though it’s graphics, so raster would be more appropriate, or am I wrong? And still nothing. Each time it warned me of the “Invalid Layer”. Finally, I just skipped that step and continued with the others. If anyone could help me with this, I would really appreciate it.
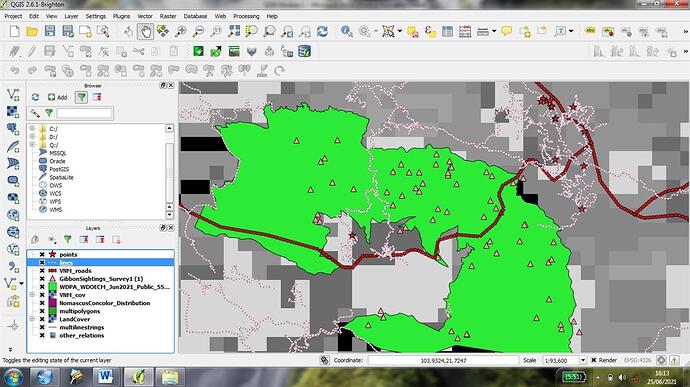
This here is a close-up picture of my final product. I played around with the symbols and colors a bit, but I turned off the VNM_cov layer because I think the resolution doesn’t fit together with everything else.
I think you are on the right track but you just need to play around with your layers and rearrange them so that you have the relevant data visible. 
thank you Bonga, will ‘play around’ with the layers and see how everything pans out 

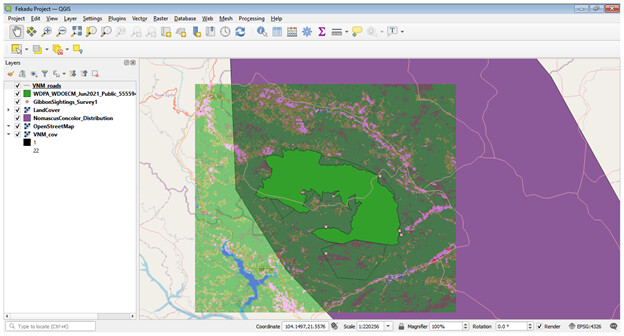
I have very interested in the QGIS course and helped for my organization in the future.
Module two QGIS course is also vital for me.
Identifying Vector and raster for our data collecting in the field are very important. we collect vector data like location of Ethiopian wolf sighting(point vector),camera trap(point vector),transect survey(line vector),identifying home range(polygon vector),slop of landscape(continuous raster),terrain(continuous raster),Vegetation type(continuous raster),weather condition(thematic raster). we collect all the above data,so it very important for us.
Hello Mengistu? Good job. I appreciate your stamina because you are doing well so far even though I know that you are busy in your job. The suggestion I may give you on this assignment is to rearrange the order of layers so that your map will be more neater and transparent. for example, the landcover layer with low resolution to the bottom. I hope this training will be a spring board for us in the process of mapping the wolf sightings, den locations, mouse burrow location/distribution areas, camera trap locations, wolf monitoring routes, wolf habitat sizes & status, elevations, critical areas, Erica/Afroalpine species/ vegetation sizes, etc you have been collecting and compiling on excel spreadsheet for years. Please keep up collecting field data this time with more attention to minimize the uncertainties we are going to face during making map with these data. Bye!!!
I was VERY confused this week on the assignment, and my map does not look like everyone else’s so I definitely did something wrong. Is anyone available to help walk me though the steps in the instructions? I wasn’t sure whether the data I was entering should have been a vector layer or a raster layer, and that’s where I might have gotten stuck. I still don’t really understand what a raster is and when to use it.
Hi Hannah. I am so lost this week, but your map looks beautiful and seems to make sense with the layers. It definitely looks clear and it’s easy to read. On my map I have the names of cities. How were you able to remove the city names on your map?
Dear Misrak
Thank you for your feedback and they encourage me to work harder in the next course. I have been trying to re-arranged the order of the layers ,but I have not seen any changes.
