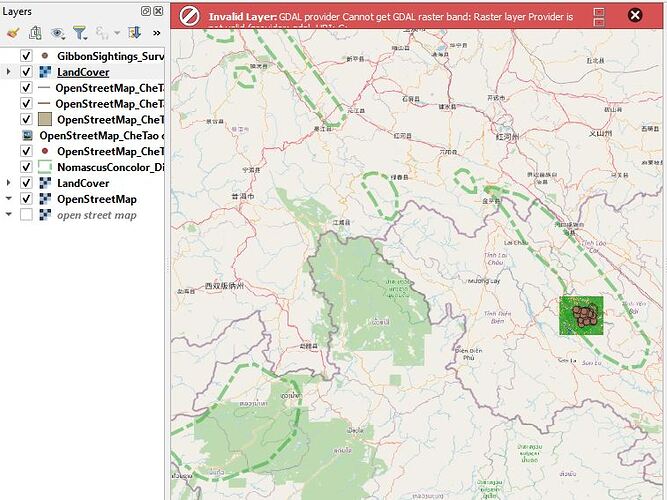
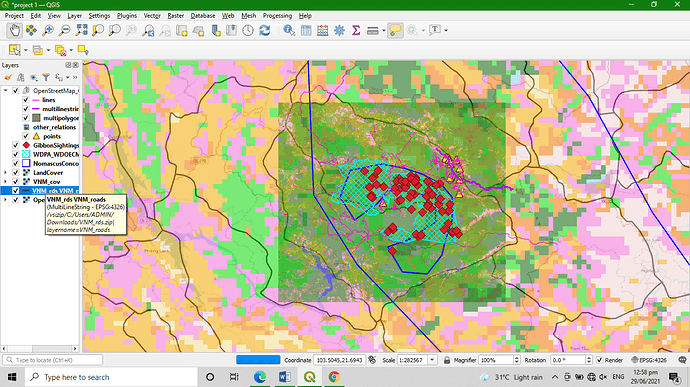
I understood the difference between raster and vector layers, but the difficulty came in when actually putting in those last raster layers, the VNM, WDPA Protected Planet data-- I unzipped, I put things in the same folder, I opened the instructed file format-- and I was not able to add any layers. As can be seen in the photo, I kept getting an error message.
I tried all over again a second time. I’ll probably go back and try again later but I really don’t know what I did wrong.
Thanks for sharing, I would love to find out how to save most effectively- how did you save sub new files within it?
I’ve been having trouble adding the VNM raster layer as well, getting an error message despite following all the instructions and unzipping everything. Do you have any recommendations about how to go about it?
I like your work
Mine is giving me tough time
Your map really look good dear.
I’m finding it difficult to arrange my layer.
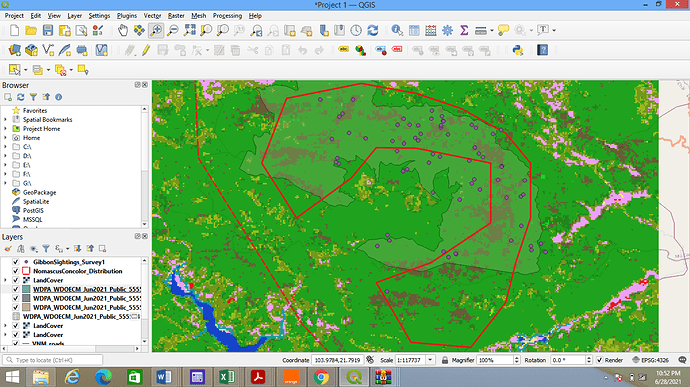
The exercise was quite challenge to me, fortunately at the end managed to realise the difference between raster and vector data. I started to understand how to add different layer of vector and raster files. Also I have learnt to re-arrange my layers the way I want it.
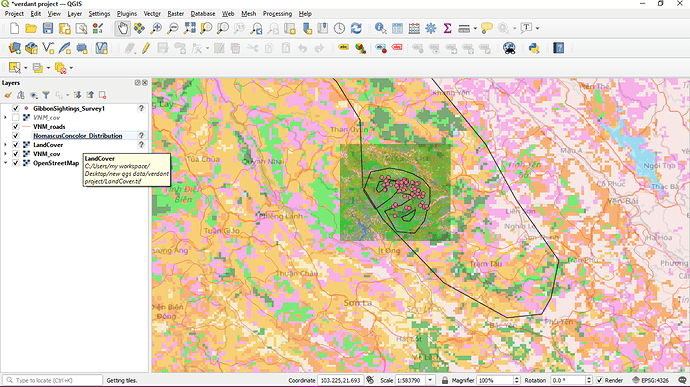
I like your work, the way you have arranged the layers is good.
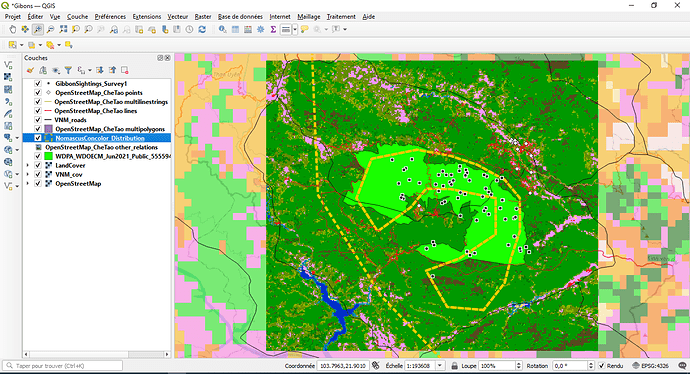
Hello Myers, good work, your picture is similar to mine I take we did some correct.
This module helped me to differentiate between vector data and raster data, it also allowed me to define well which of the two data formats best suits my work.
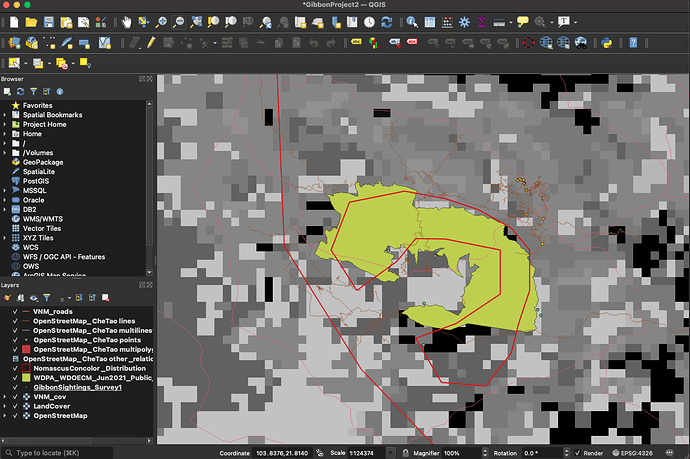
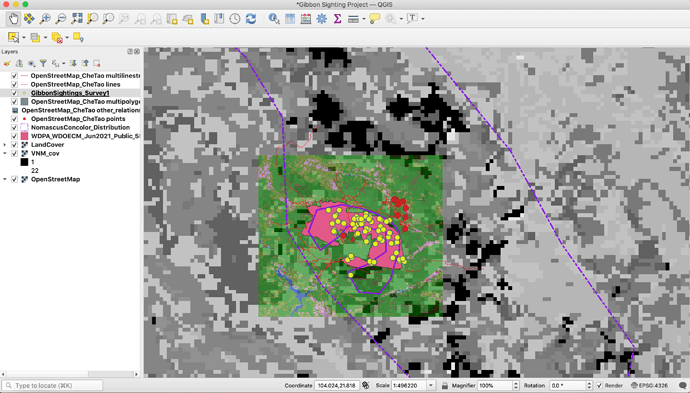
I’m not sure if this is entirely correct but I do find it interesting that this appears to have a low resolution or coarse grain spatial data, which I have not worked with before. Although it is not the type of data I am used to seeing it is fun to discover something new! This module has helped me progress towards my goal as I now have a better understanding of vector and raster data and how to decipher between thematic, spatial, and temporal data.
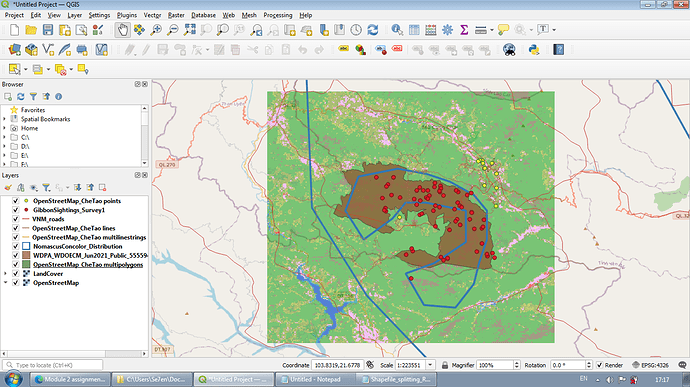
This module was a bit difficult for me as, for whatever reason, I struggled to follow and, more importantly, understand the instructions. After working with the map by rearranging some things and messing with the colors, as others have suggested I feel like I better understood the module. I feel like simply experimenting with the map styles is what helped solve my problem of not comprehending what I was doing, or at least feeling that way. I am not sure if my map turned out correctly, and any feedback would be welcomed!
I love how bold your map is in terms of the color and line choices. I also appreciate your discussion on the resolution of your own graph. I would suggest adding back the data points, or reordering your layers so that they show up, in order to better demonstrate your data. After reading your reflection, I looked back at my map and tried to better understand the differences in resolutions and uncertainty.
you did great, I like the color you used in VNM roads its looks like a maps of lava flow 
In making the module 2 I encounter a slight trouble, the instruction were little vague and I had trouble with displaying certain layers but after an hour exploring and discovering different feature and ways I had able to solve the issues.
This module help answer my question in the previous module of what is difference between vector and raster. I enjoy editing and playing the new added layers in my project. I also try to compare the differences views of my map with or without using that layer. This new learning is a big help in my field research study in the future.
Hi @Willemien, thanks for your feedback! I will definitely try to bring Open Street Map up one layer. There are no official “roads” in the protected area, however there are definitely some 4X4 tracks, so I will check to see if they are on Open Street Map, but I doubt it. You are correct in that the elephants are almost always near the edge of the forest. They are forest elephants and they don’t like to be out in the open, but they tend to come out into the savannah in the morning/evening or after it rains. The lighter area is open savannah - in the rainy season the savannah has grass that is 6 feet tall, and in the dry season it burns completely and there is no grass at all.
i learnt the different types of spatial data, differences between vector and raster data. i learnt about the types of raster and vector data.
my question is that i do not understand the uncertainty we were asked to discuss
wooow nice work. i love the arrangement of your layers
Thanks @CourtneyF for your observations and comments. I will follow your directives in order to make further improvements.
Cheers!
Hey Bro., I think if you want a bigger map, you can play with the zoom tool. Well the grey nature may just be one of the default outputs from the analysis. I am not an expert in this Bro (still playing around). I will suggest you chat up @CourtneyF, who may be willing to help out.
Cheers!
