Your work looks great. Love the order of your layers. Everything comes out clean.
If I saw your work before now, I would have also changed my CheTaoNatureReserveBoundary fill colour to white. Good Job.
1 Like
under symbology tab, you can also make your layers transparent. this helps when struggling to order layers.
1 Like
I found this module very helpful and it cleared up a lot of what I had questions about after the first module. I appreciated the sorting quizzes! I spent some time playing around with color and opacity to make a more presentable map, but I don’t think what I ended up with was the best, but that’s ok!
Because I have a Macbook I also had to “select all” when importing the OpenStreetMap file.
2 Likes
I had some trouble with this one! Due to not understanding the file types needed, I had to try a few different files before it worked out, and I’m still not sure what some of the lines represent, so any advice would be much appreciated. Was interesting to see the large difference between the fine grain and coarse grain reserve boundaries.
1 Like
This module was very easy to understand as well! I enjoyed comparing the detail of the different layers. I did miss one of the layers to download- the OpenStreetMap “fine grain vector data” and after going back and downloading it I’m still not entirely sure what it represents? Is OpenStreetMap_CheTao Points just local points of interest?
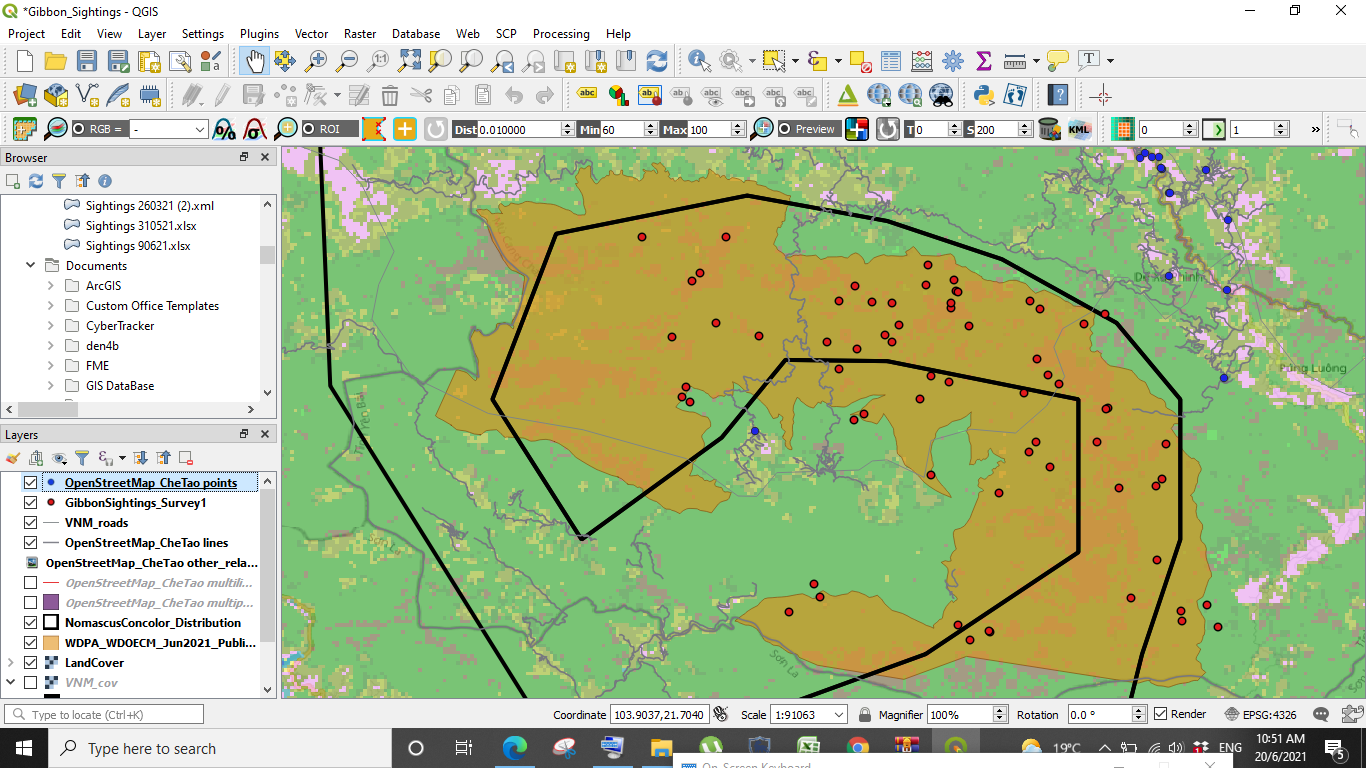
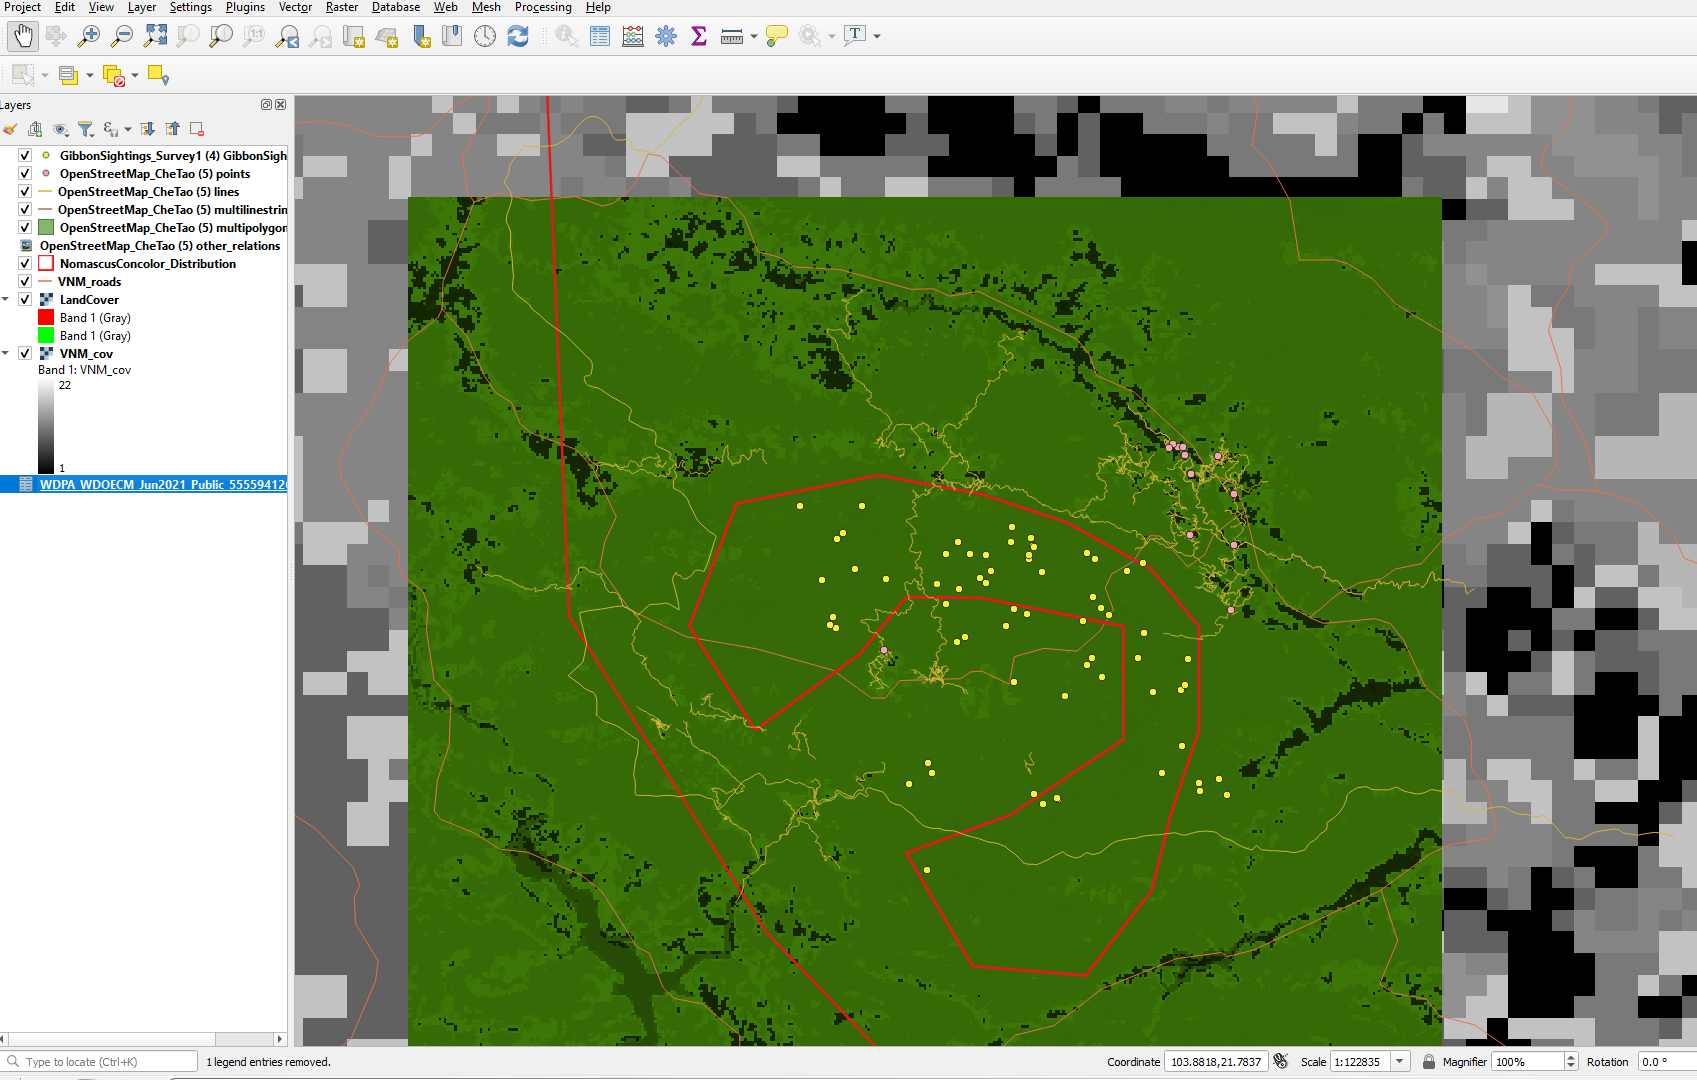
Hi! The files confused me too. What I did was to move the VNM_cov layer between the Land Cover and OpenStreetMap layers so I could see things more clearly.
I think your map looks good! You could also make the reserve opaque so that you can see a bit of the land cover info below? I like that your roads are a dashed line- I did that for mine as well.
1 Like

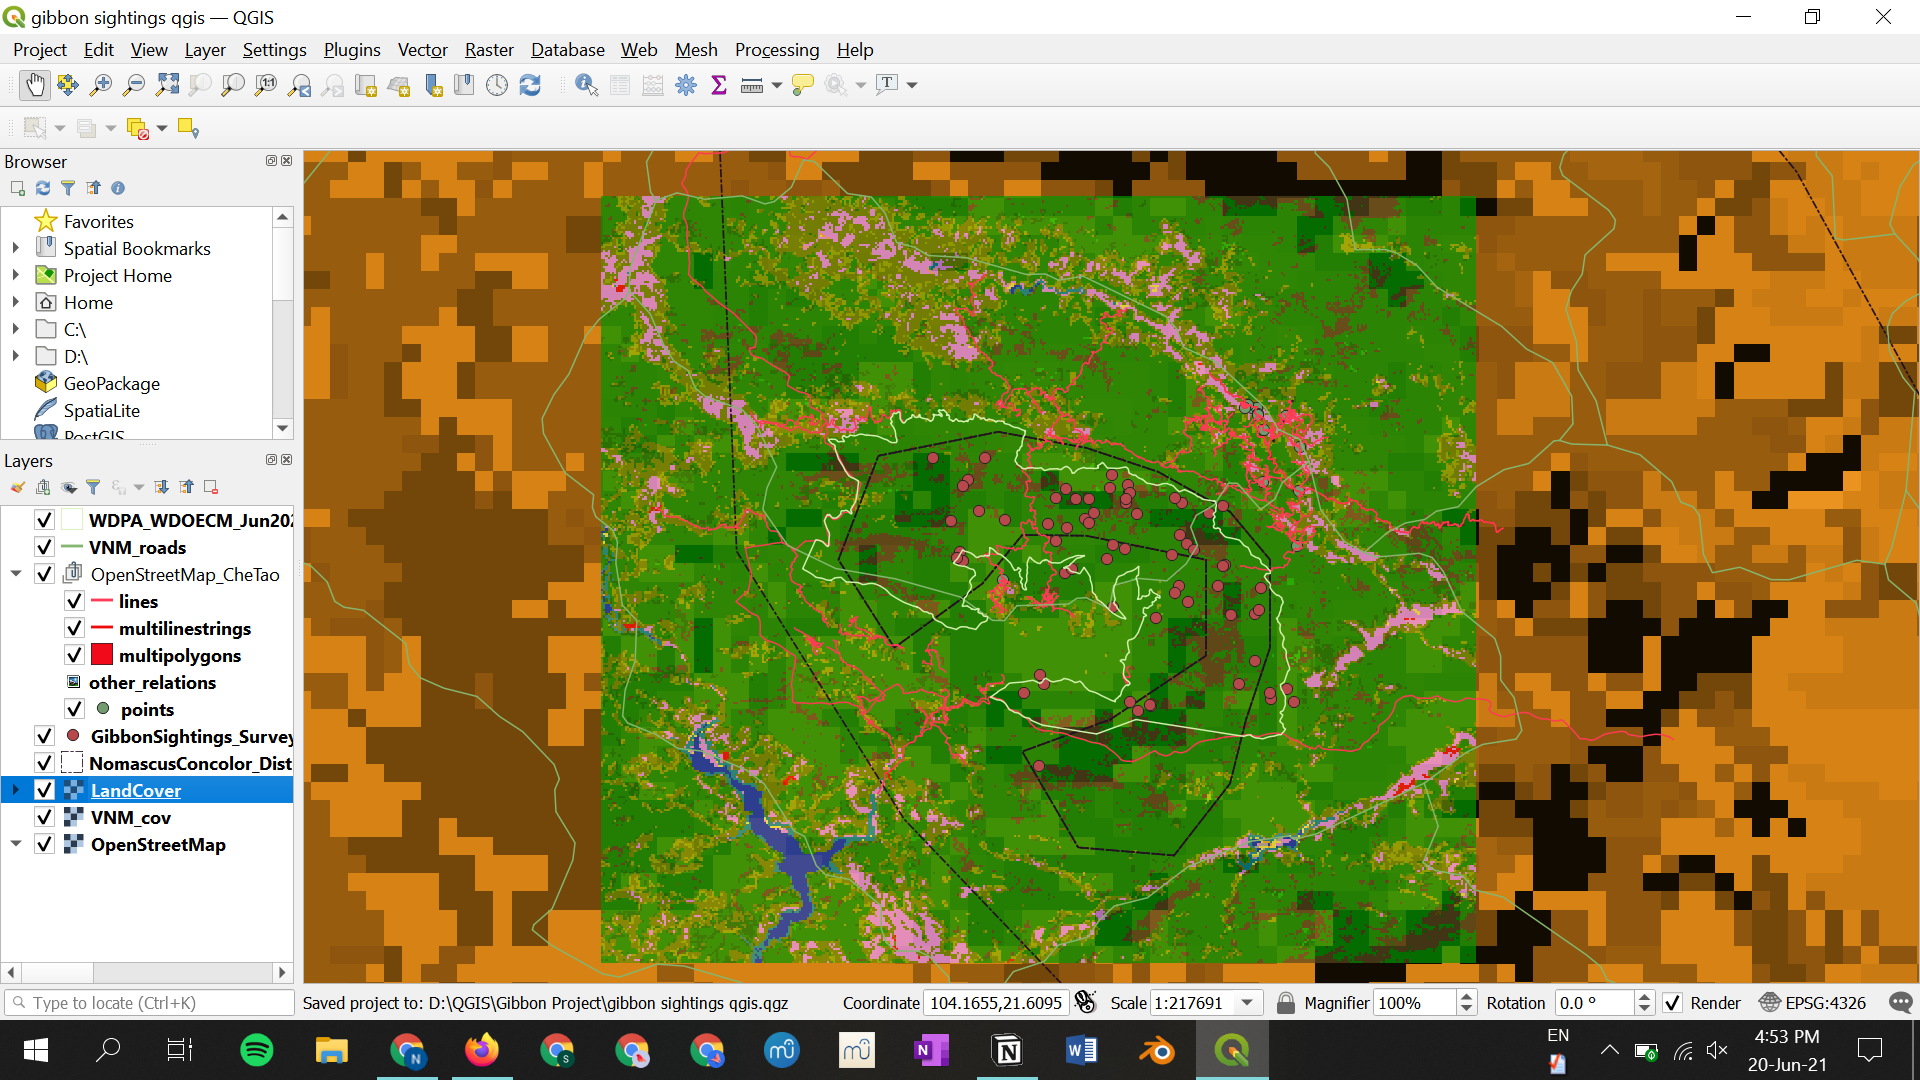
Here’s mine - Was interesting to look at the different layers and the details that were in included as well as the variation in resolution.
I have a much better handle on the differences of raster and vector layers now and also just in manipulating how the layers are displayed
1 Like
thank you am seeing wonders now

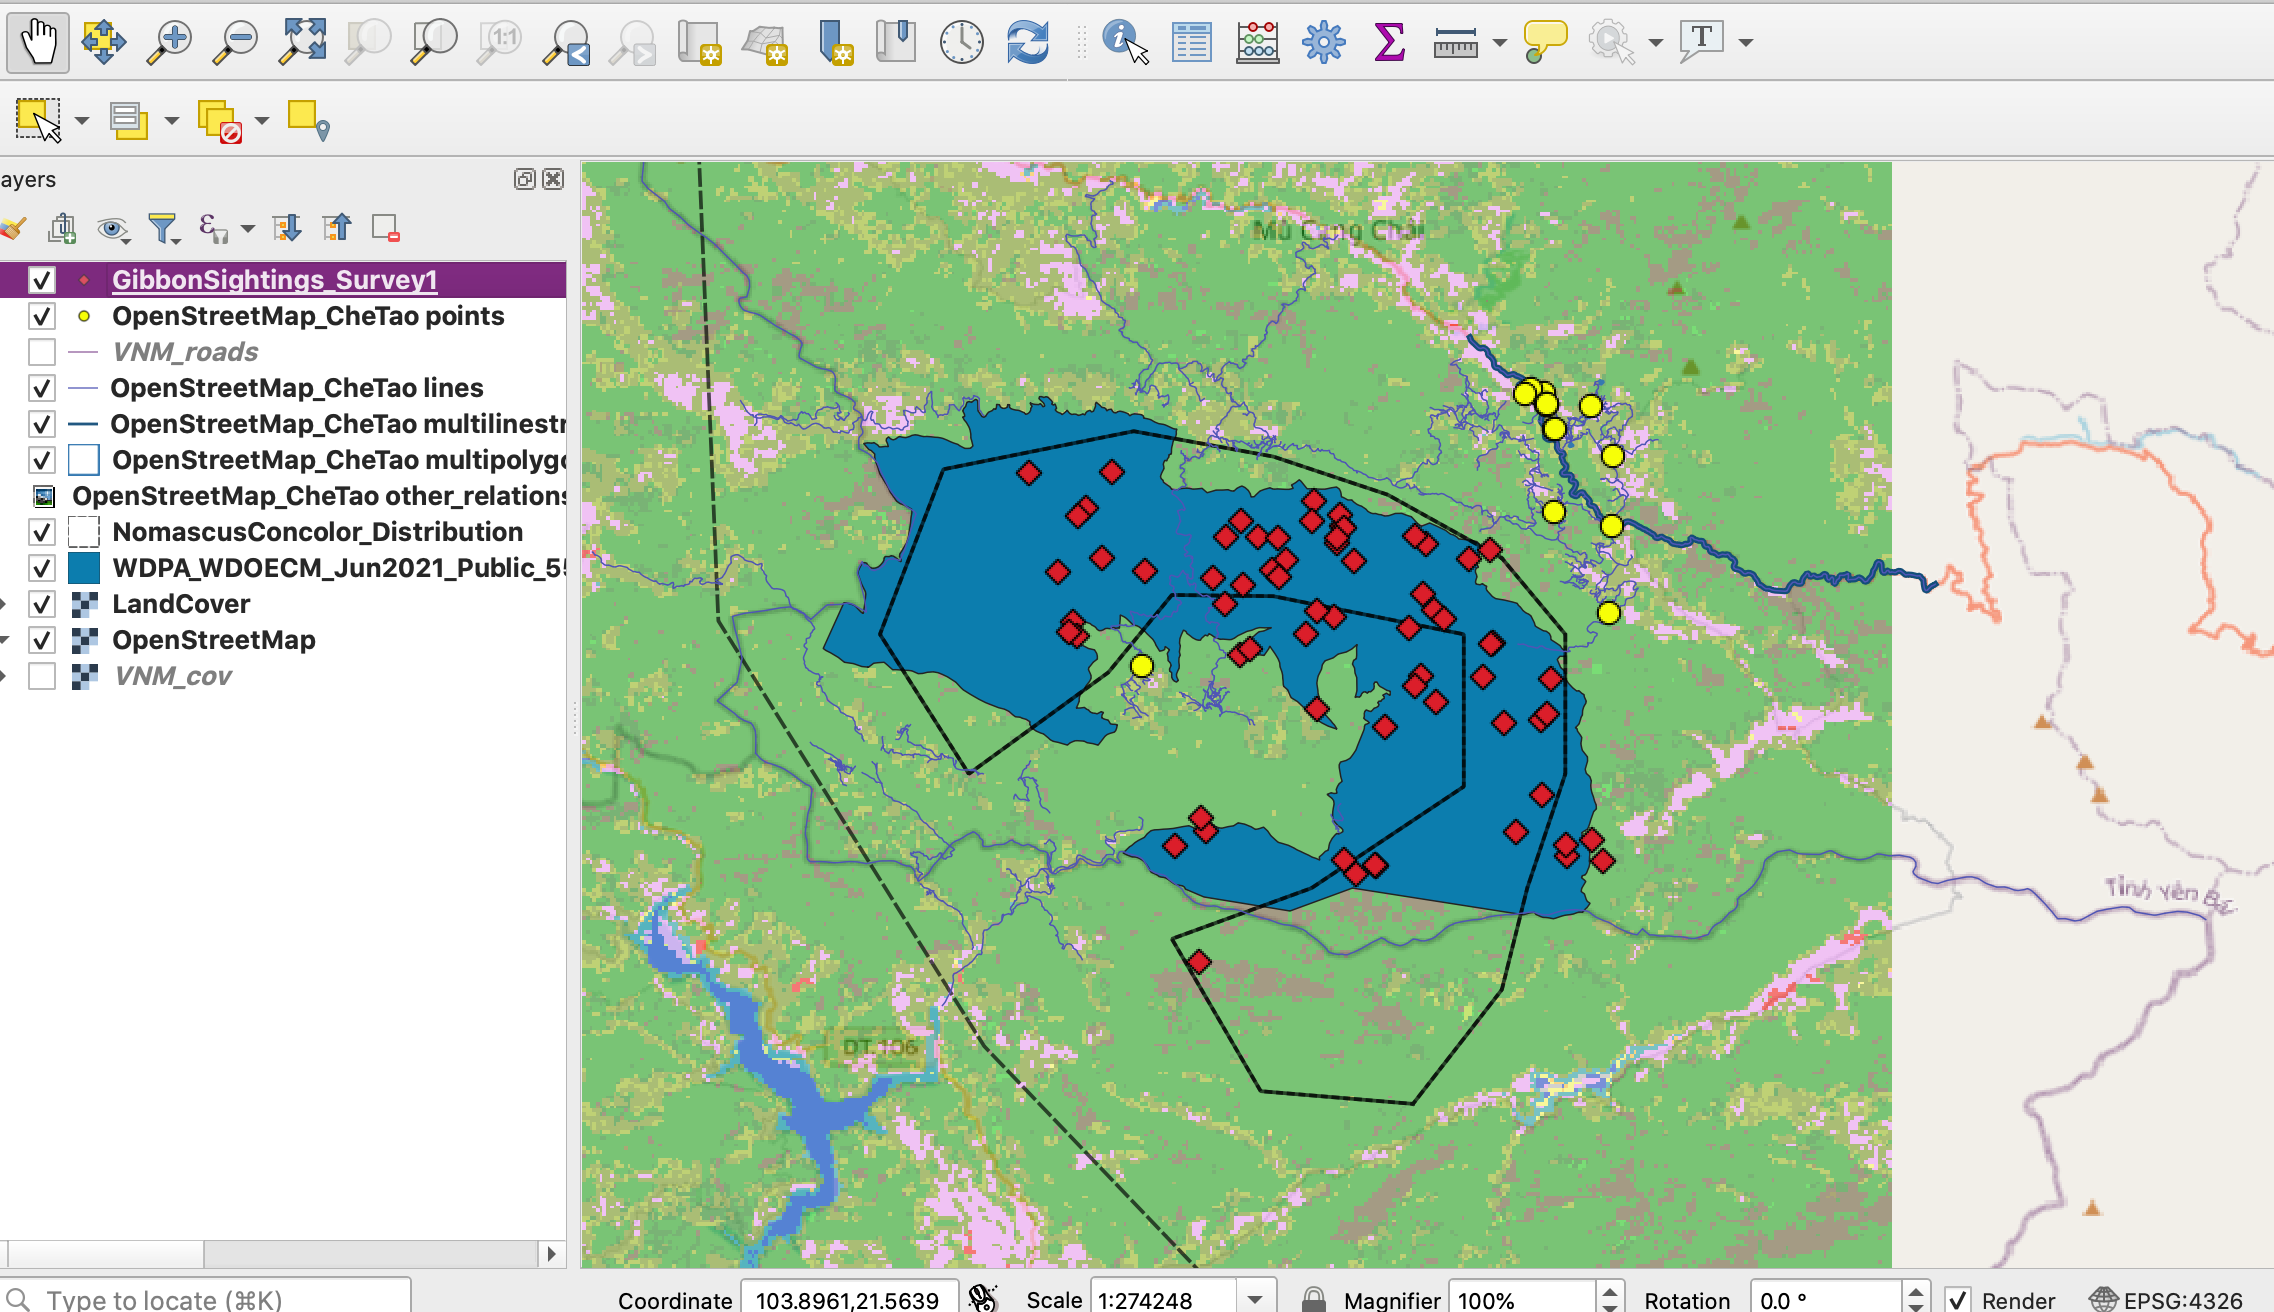
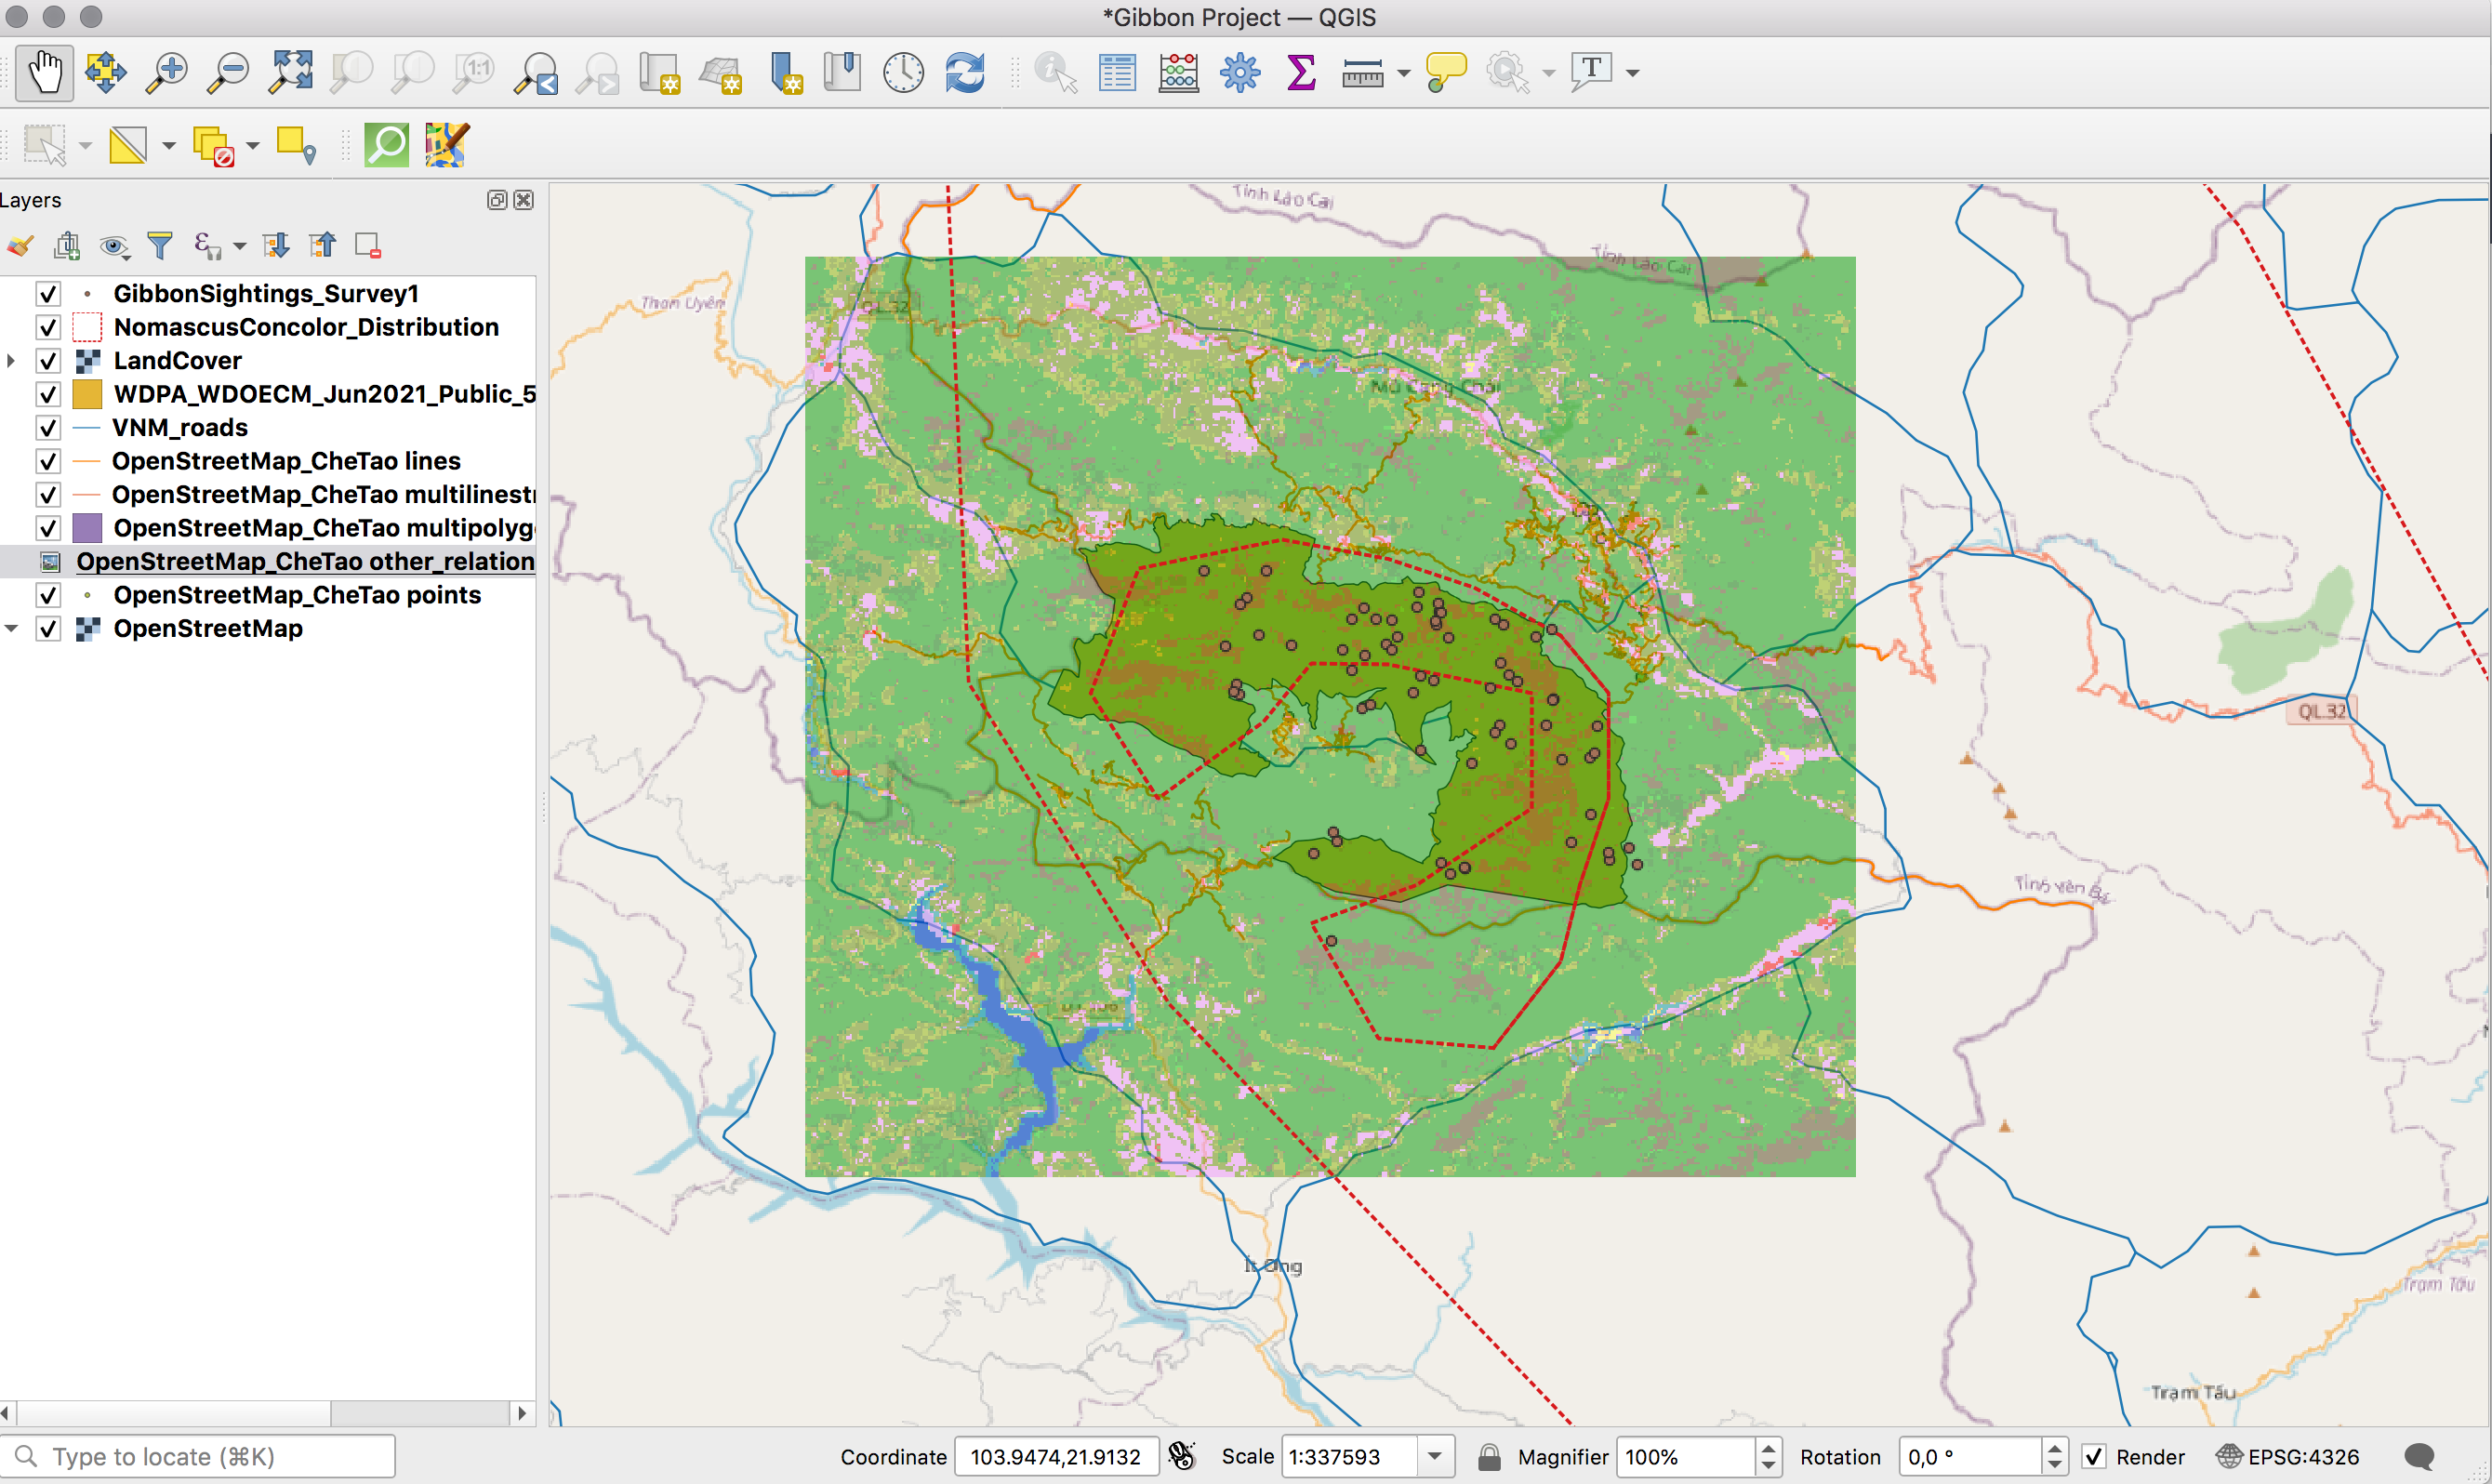
I had a few problems finding the right files to download but once I did everything seemed pretty clear. I experimented with various colours and opacity levels etc for the layers, increased the thickness of the roads and moved the order of the layers. I also changed the markers for the OpenStreetMap_CheTao points layer so as to avoid confusion with the markers for the GibbonSightings_Survey1 layer.
I think this module has helped me to learn how to best represent data and make comparisons between them. I did take more screenshots with various layers hidden as I went through the instructions.
1 Like
I wasn’t sure about the fine grain vector layer at first either. I was wondering what those points were too. On mine, the symbols default setting was almost the same as the Gibbons Sightings layer points so I changed them to make them clearer.
Your map looks great, very clear and good use of colour 
@Sichelesile Your map looks great, very bold and clear colour scheme.
1 Like

I’m not sure if I completed the assignment properly, I had trouble finding the file that the guide suggested and attaching it through the menu. Within the download documents I did not find the file with the ending vtl, I would appreciate if someone can advise me on this.
How did you found the real one, I get stock there
1 Like

The module is helpful and easy to understand as well. I enjoy the exercise that compare different layers to get better idea of different extent and resolution. Had a little bit of fun playing around with the opacity and different colours.
1 Like
Hi everyone
I don’t know what I’ve done wrong, or am not doing correctly but I cannot seem to get the shape of the reserve outline. This is frustrating and I’m stuck. Can someone please help?
This module was great at clarifying terminology such as vector vs. raster. I’ll probably need to refresh myself on the difference every now and then, but now I know the basics!
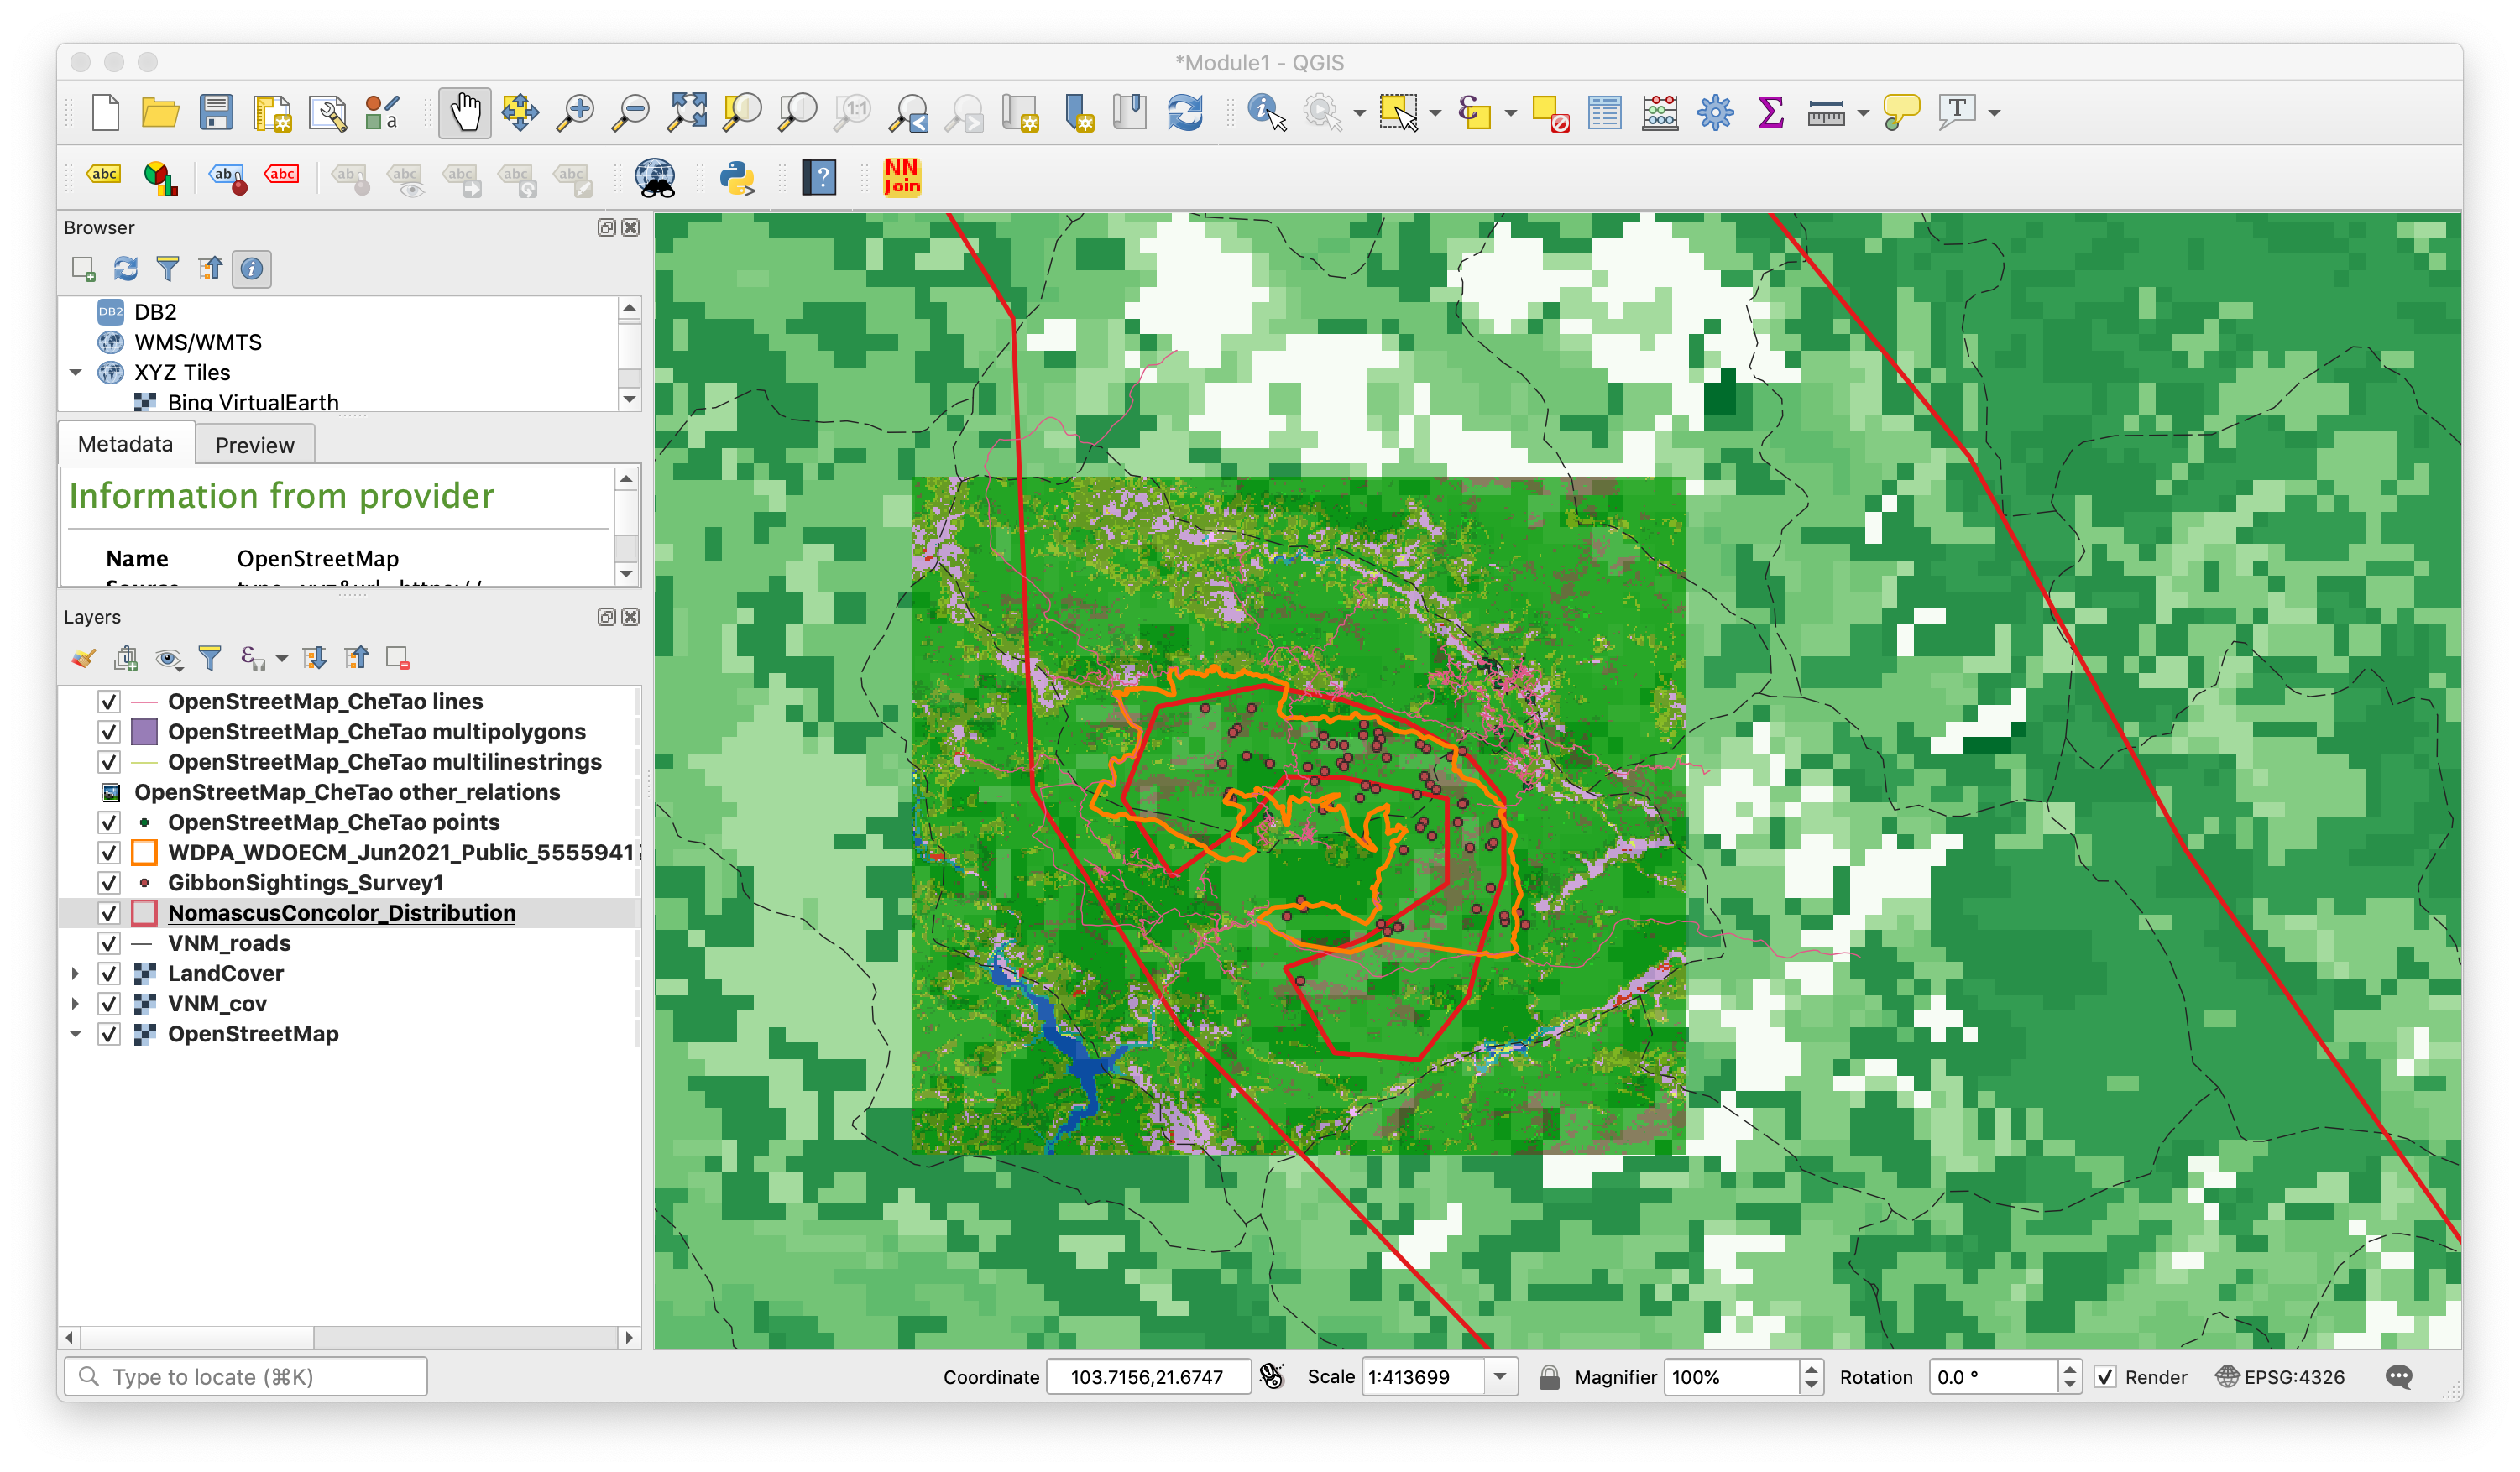
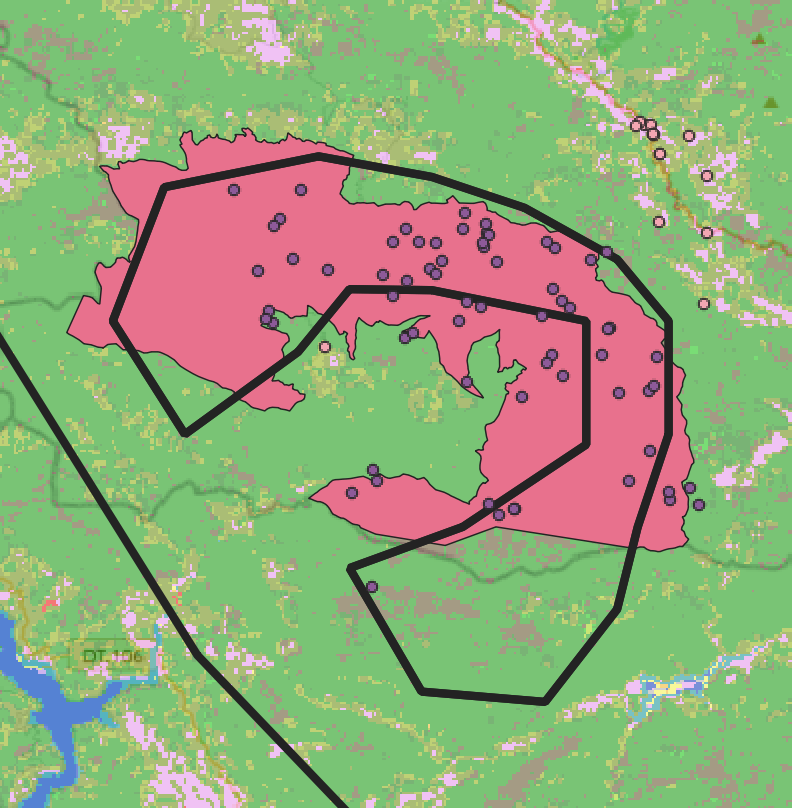
I chose to represent the module’s work in this manner because I think it’s a great example of resolution differences between two files that represent similar things. As one can see, the Protected Planet Che Tao boundary is at a much higher resolution, and visually, it’s interesting to see what ways this was simplified to make the overlaying polygon. I put the Che Tao boundary as a solid colour behind the outline of the IUCN polygon so it is easy to tell which is which.
I did encounter one problem which was the lesson did not say what file format to download the Che Tao boundary in, and I defaulted to downloading a .csv since I’ve been working with R a lot. It wasn’t too much of a problem, as I figured .shp would fix the problems I had since most other files in the lesson were .shp.
1 Like
Hello, I think I had a similar problem! What happened to me was that I downloaded the data as a .csv, not a .shp. I’m guessing that you did something similar since the icon next to the layer (where the check box would be) looks the same as mine did when I uploaded a .csv.
You’ll want to download the data as a .shp and upload the .shp file into QGIS if this is the case for you. I hope this helps a bit!
Hello, I really like the colour choices you made here, since the module was about contrasting these different data sets and it’s simple to tell where one data set ends and the other begins. I’ll try doing this with my data.
I’m also new to this but when I downloaded the .shp, the folder containing all the different languages also had a zip file inside. This zip file had the data.
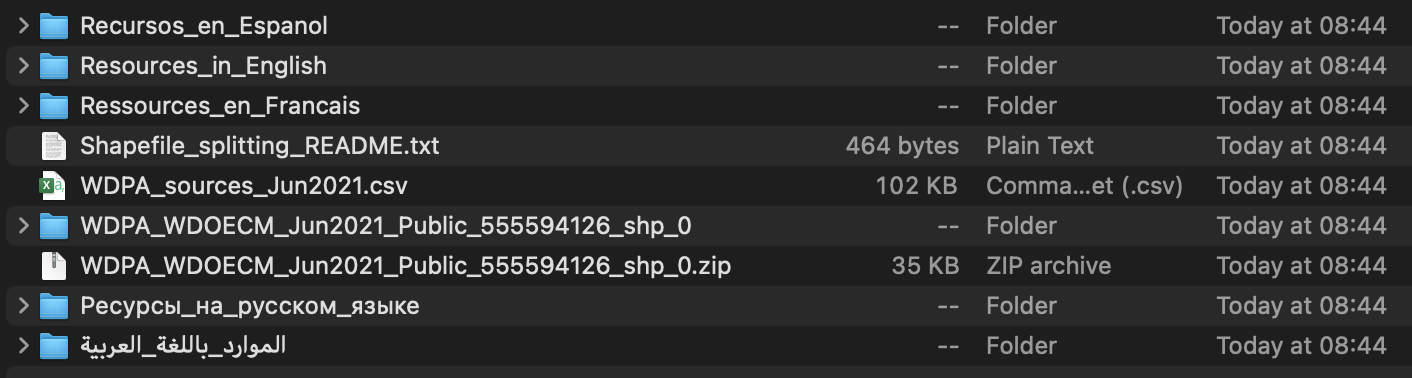
In the screenshot the zip file is 3rd from the bottom, so maybe look for it and see if it’s in your folder.
I hope that helps
1 Like
Im aware that we need to start making these maps our own but I would still like to see throughout the course how I can utilise the landcover later. I know it is a lower resolution detail but I want to incorporate details like elevation etc into my map so hopefully I will be able to figure out how to use the landcover map to my advantage as the course goes on. I really enjoyed this module as I could now differentiate between vectors and rasters and how to apply them with different kinds of data. This module I struggled to navigate the zooming out and zooming in functionality. I found myself often by accident zooming out fully to the world map and it would take a while to zoom back to the focus area. The zoom in and out tool is also quite hard to use as it doesn’t allow a range of motion really.