Hi there, for the nature reserve boundaries you have to find the shapefile folder within the folder for the nature reserve boundaries and then you can drag the shapefile file from that folder straight into QGIS. I hope this helps!
1 Like
I find it easy to understand your map. It looks clear with the details and colors that are presented here. As I also did quite similar to yours too.
Happy learning!
1 Like
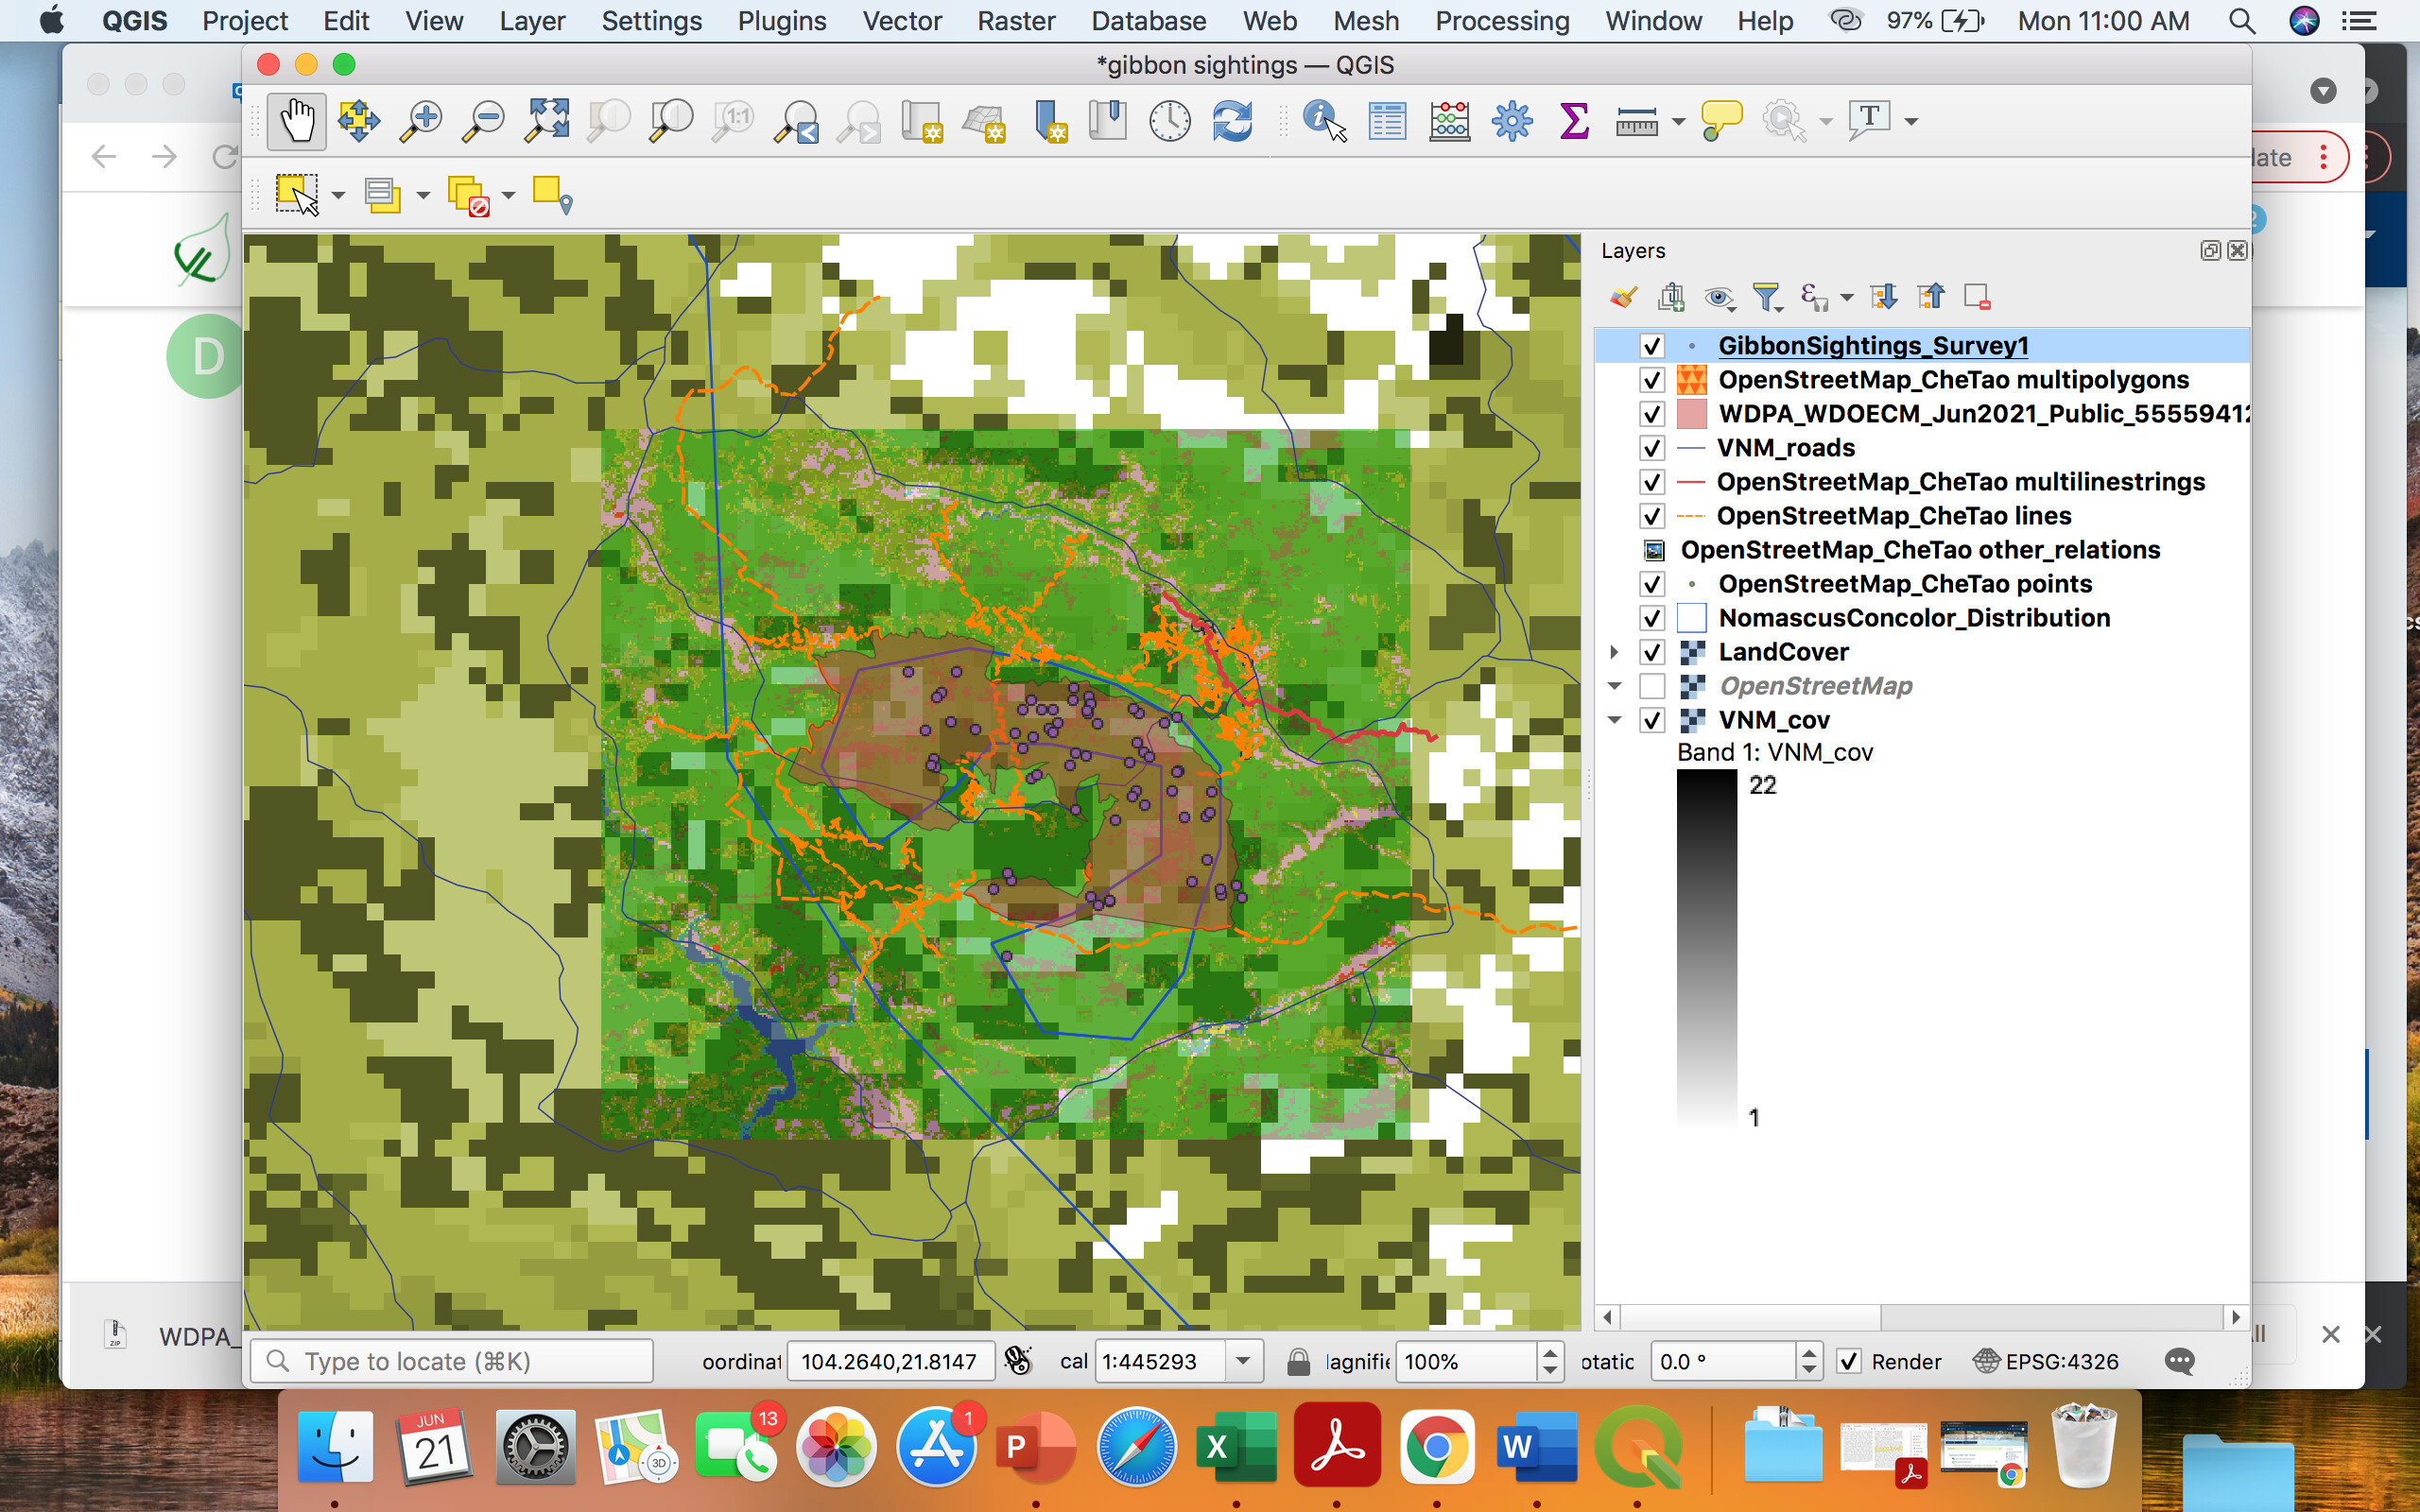
In these modules, I’m able to understand more clearly the differences of raster and vector layers with the aids of the quiz. Moreover, I could finally manage to complete the assignment with a few trials and errors to understand the concept and reorganized it in the layers section to avoid mess and a more presentable map. However, a few struggles as to fully understand the meaning between resolution and the extent.
Hope this is what was expected. Cheers!
3 Likes
This module has taught me what the various types of rasters and vectors are, and grounded them in real data, relevant to my work and interests.
It has illustrated how varying resolution can be pertinent, and made me consider resolution and uncertainty with regard to me work.
It has made me consider how much uncertainty is tolerable for asking the questions I aim to ask, and made me more aware of the role of uncertainty in evaluating the work of others. Through this it has bolstered my agnosticism towards all things. However I am agnostic as to whether this was a help or a hindrance.
Hey there. Nice work. I had the same difficulty with the zoom tool. I guess there is a sensitivity setting we can use to set the zoom tool appropriately.
I found the description of the differences between raster and vector, and resolutions etc. really useful. I’m not sure that I followed the instructions in the exercise correctly though
I always seem to have an issue with the last portion of each assignment this time it was adding the protected area map got a little bit confused initially with locating the shape file but played around with the different files until I managed to upload the correct one. Loved the two quizzes nailed the first one however had to re-read and understand the second one for a better score. Still have issues with arrangement of layers to best show all features
In this module, i learned how to access GIS data. Diva GIS is a good source of data, reliable data for my country.
The difference between raster and vector data (discrete features) became clear. This distinction is important in displaying data/layers. I have to order vector data to be at the top so that it is not covered by raster layers.
I struggled with raster symbology. how do you change the colour scheme of raster?
1 Like
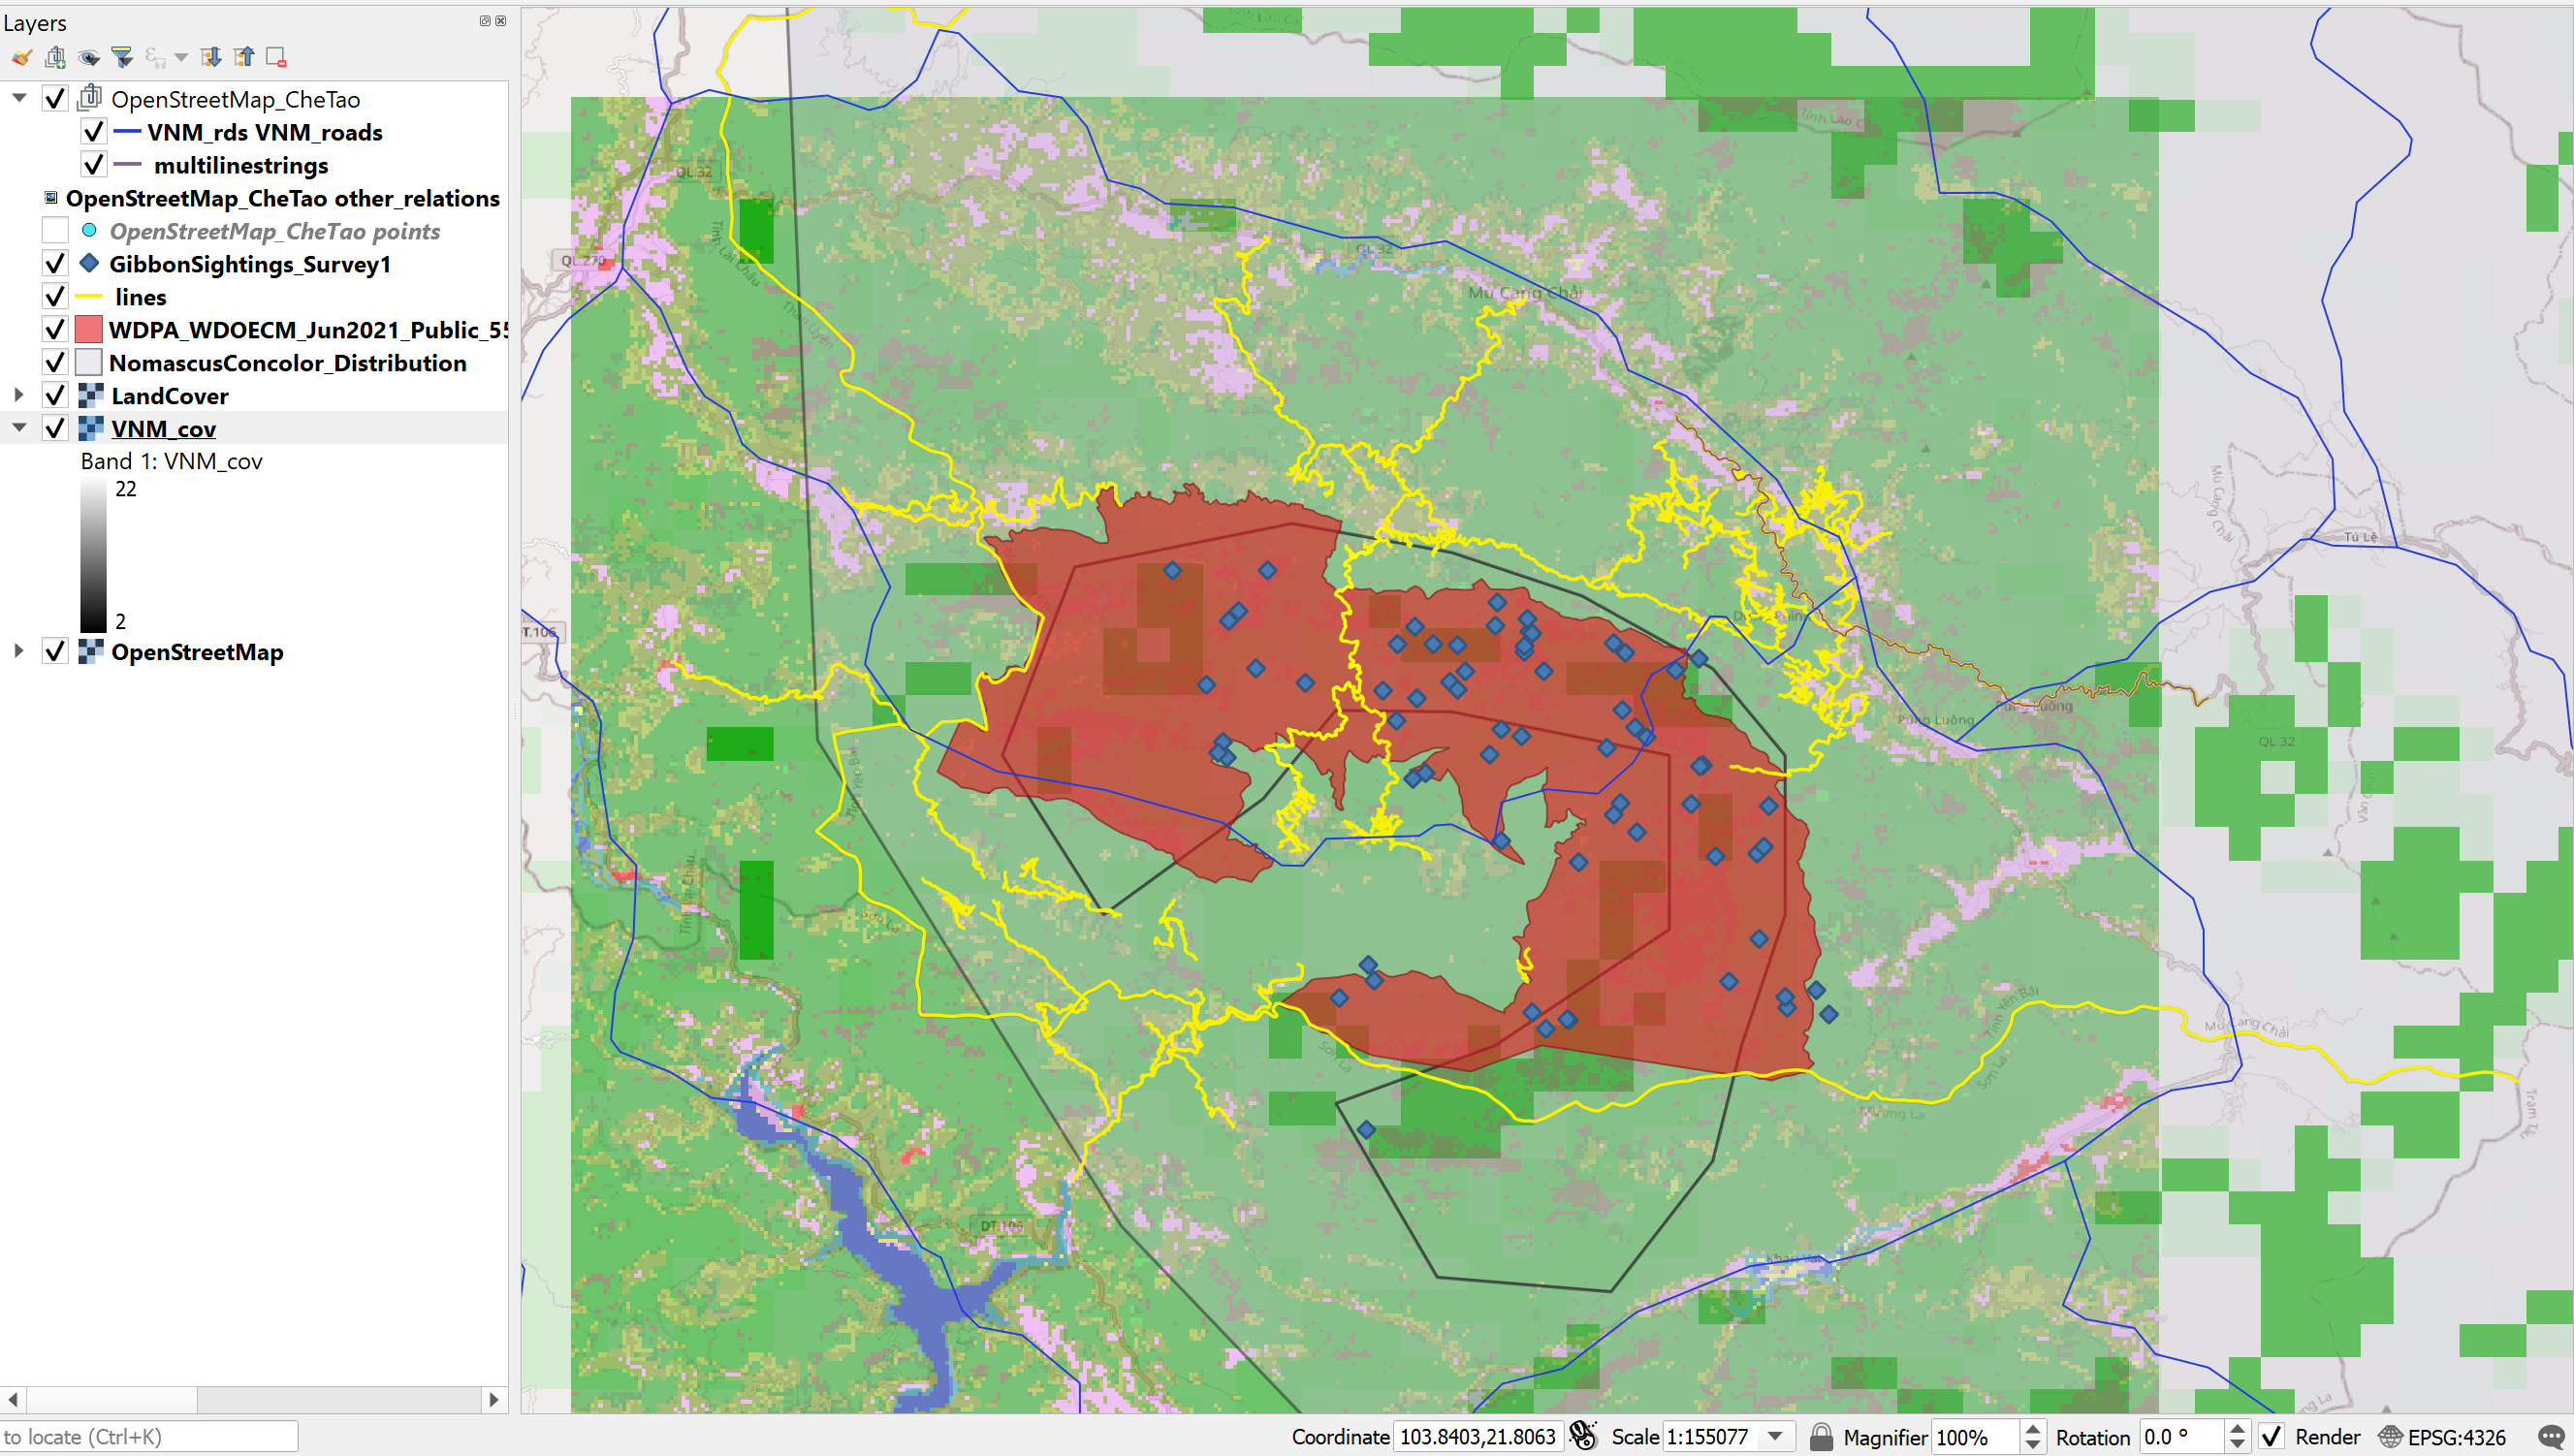
arrangement of layers: make sure raster layers are at the bottom and vector (points and lines ) ontop. you can also play around of raster transparency (opaque) to improve contrast of the layers. but you did good here, maybe you can work with different colours.
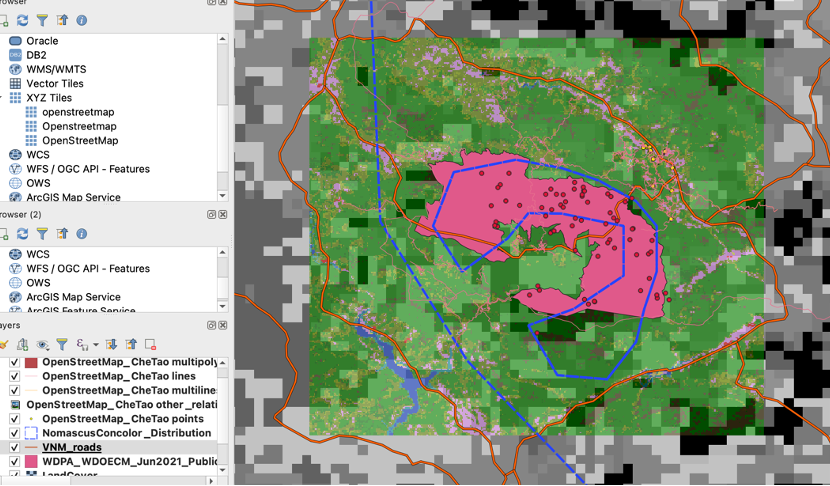
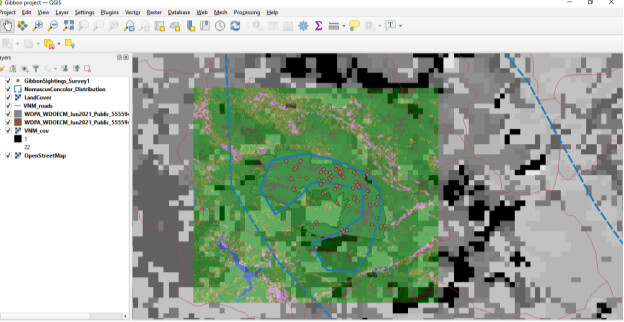
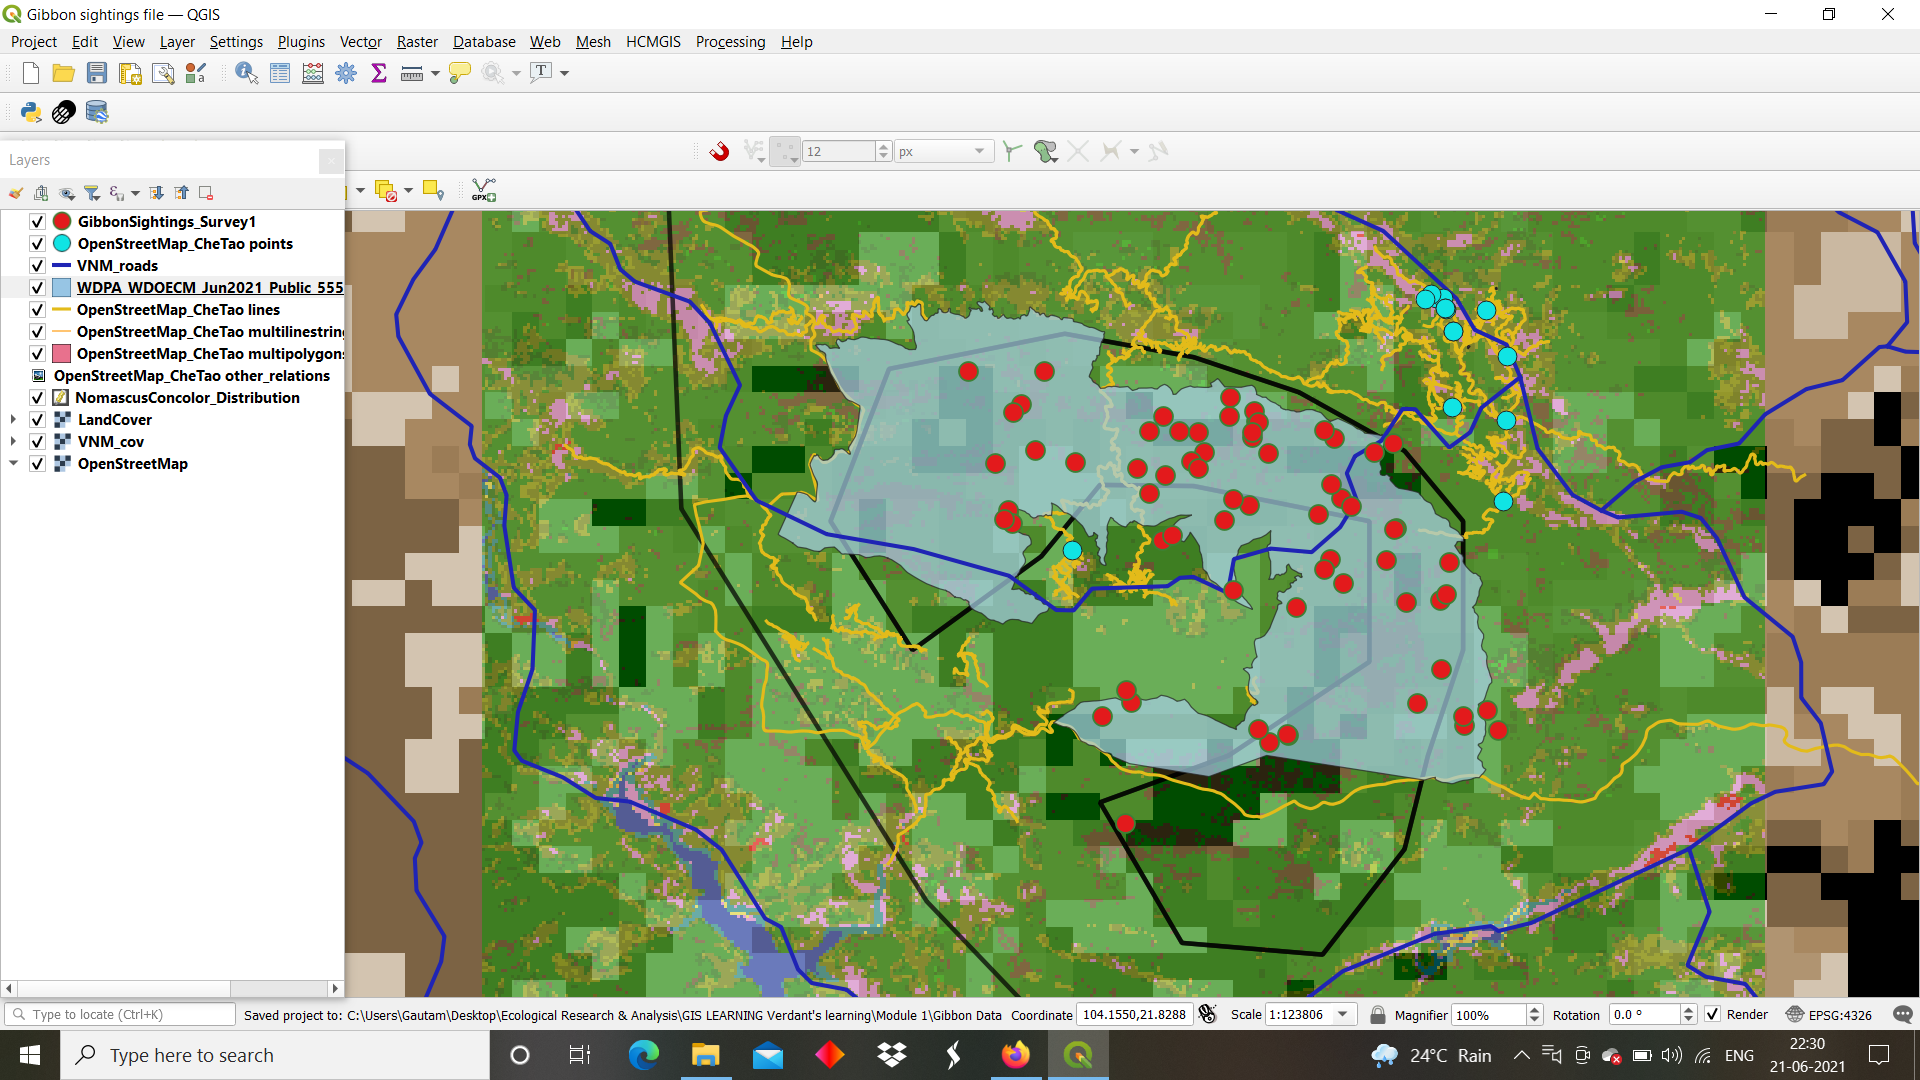
I really like your map and the use of the maps as you are able to see all, even the OpenStreet Map and the VNM cover together! I definitely try to get this as well. My suggestion is that you can see the OpenStreetMap CheTao points difficult. Maybe you can move them up in the layers or give them a different color for more visibility.
1 Like
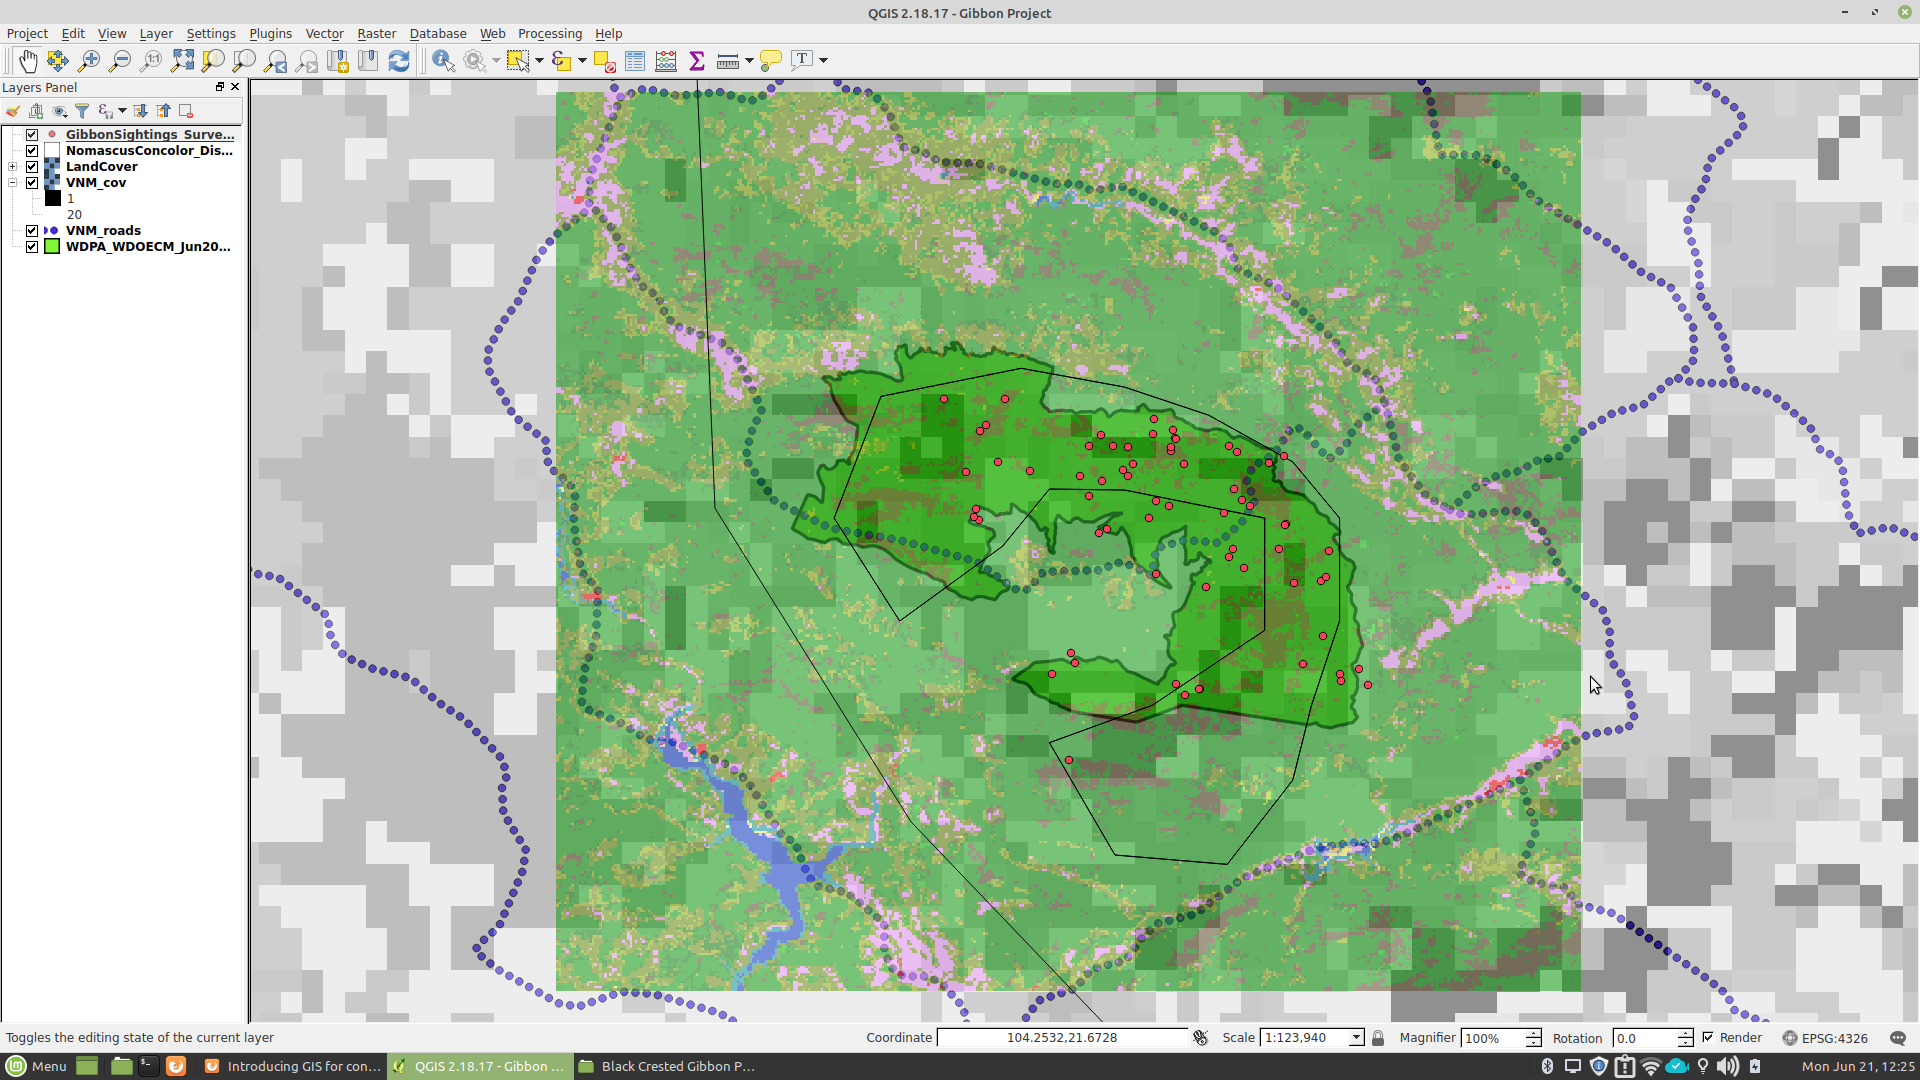
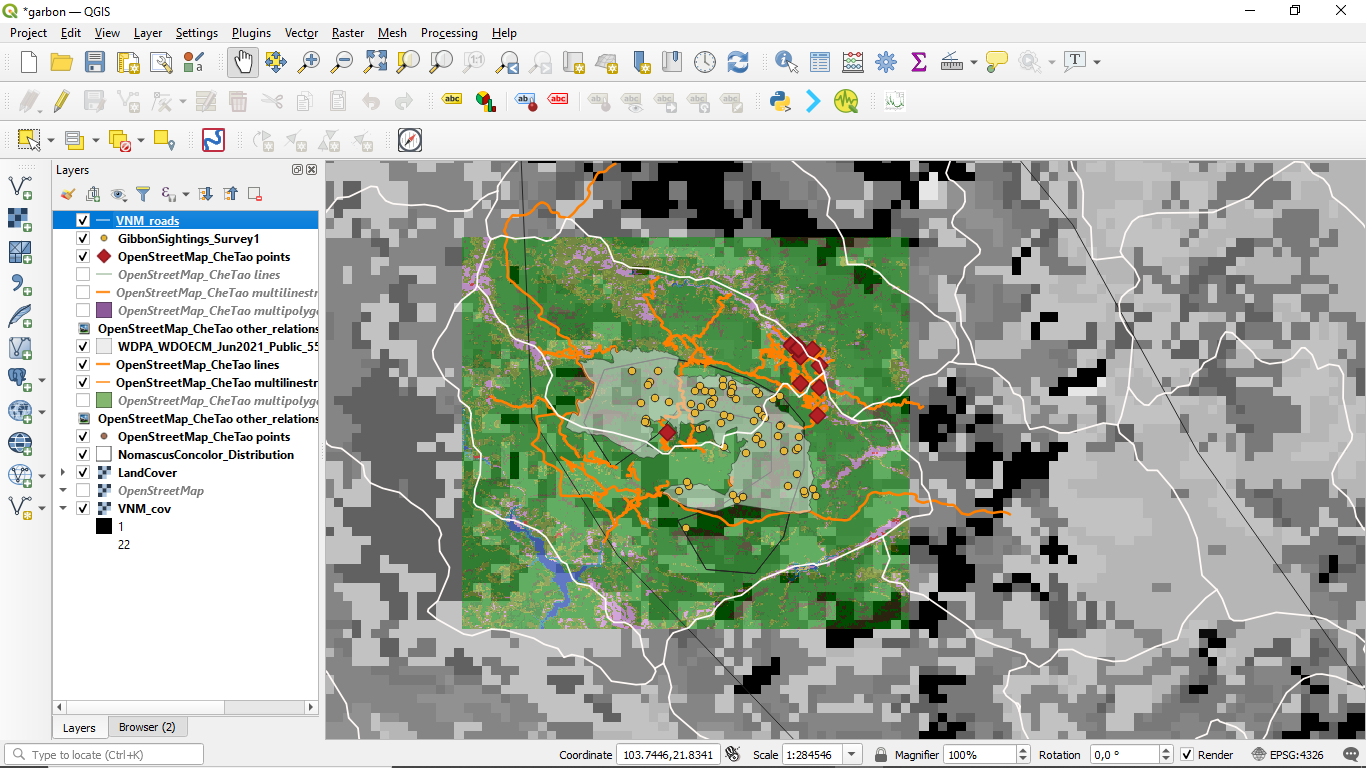
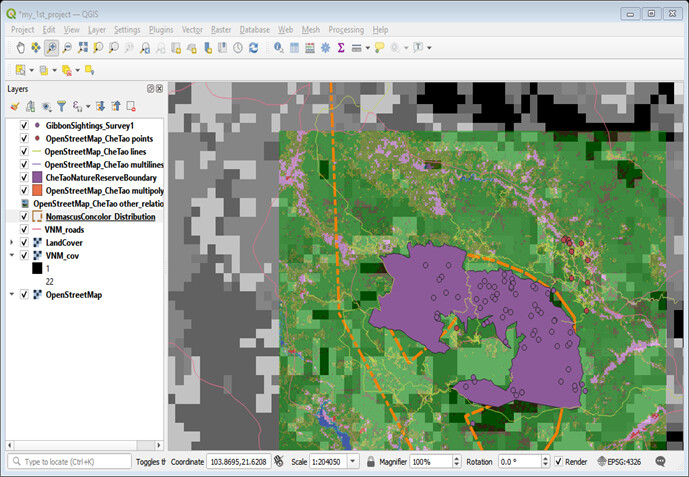
Module two was challenging at first but with careful reading and practice, i managed to pull the above map. The order of layers is very important for visibility of the map. Playing around with symbology made me realize that there is a chance to make your map presentable. I now have a better appreciation of vector and raster data.
I wish i had my own data set to practice or play around with. It was a great assignment.
@jacelynsee great map there, got notes from your screenshot for proper layer arrangement so as to produce a more clearer and detailed map. Thank you.
1 Like
@Sianes your work is amazing, can you please let me know about the procedure to add polygon layers of Che Tao protected area reserve as i am getting difficulties in getting its proper shapefile. I have tried many a times but every time my downloaded shapefile has issues to be added as a layer…
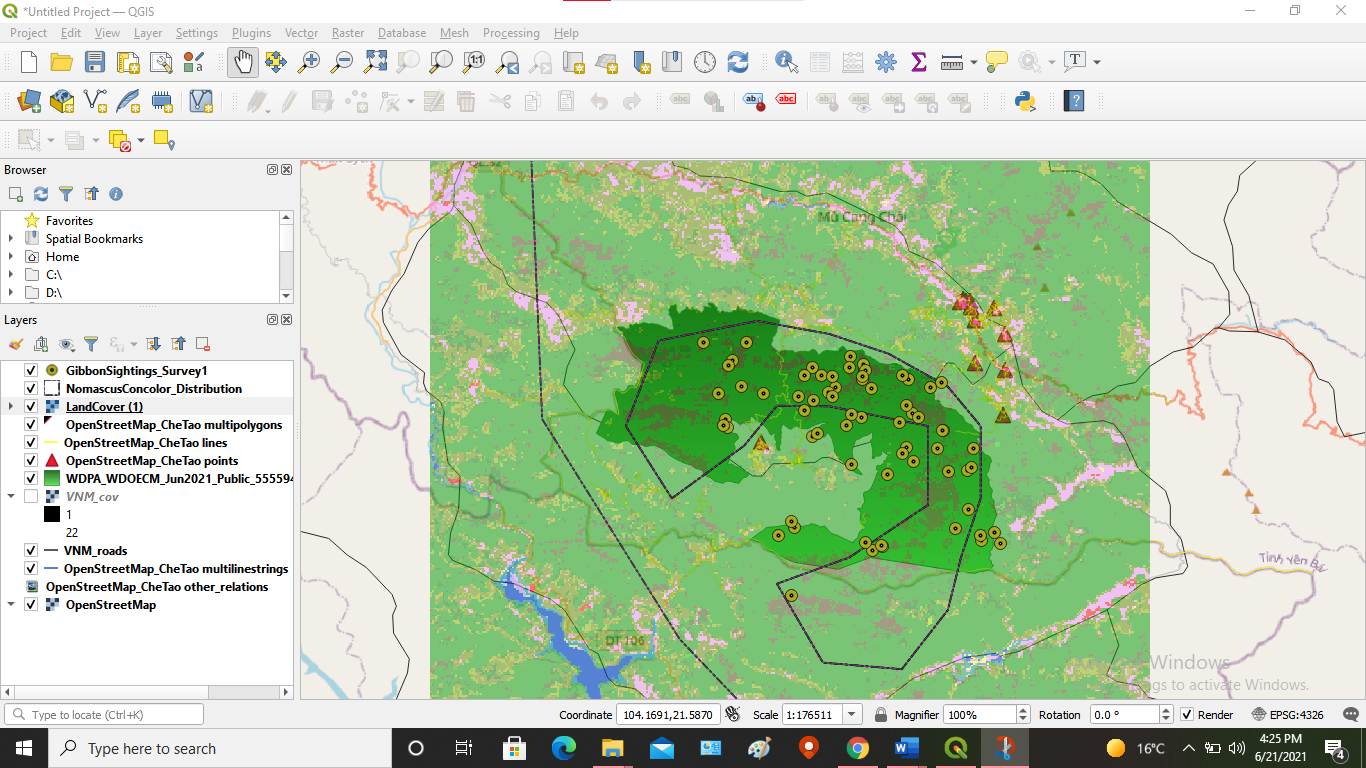
This module was interesting, I also thought the instructions were a little vague but I think I got it sort of figured out just by playing around. It seemed like I had a few more layers than necessary in my layers list, and I really couldn’t seem to find the open street map for CheTao on my map, so not sure where exactly that comes into play. I altered the order of some layers and changed up opacity and color to make things more visually discernible. I also looked at some of the other maps on the forum and unchecked the other ‘open street map’ layer so that I could see the grid VNM cover represented, which I don’t think was in the module instructions? I did like learning about the differences between raster and vector, that was cool.
I think this contributes to my learning goal because I am more familiar with adding land cover data and raster data now, which is helpful.
I like your map, its pretty easy to discern. I was also having trouble with displaying certain layers without hiding others, for instance- I couldn’t seem to display both the VNM cover layer and the open street map layer at the same time.
It was quite interesting to go through this module and being a beginner i have learned a lot of tricky and minor but important concepts of GIS mapping (eg. data forms - Raster and vector). The most important thing i have learned and cleared my doubts is of different types of Resolutions and how to differentiate between a low and high resolution in spatio - temporal GIS data analysis.
1 Like
Module 2 consists of very interesting topics. Vector & Raster data models and Resolution are few to mention. In this module 2, we are more involved than in the previous. For instance, letting us to choose the appropriate data models (vector and Raster) for our own field data and determine sources of uncertainties is pragmatic in its approach and appreciative. The “Resolution and Extent” topic of the module is a bit fuzzy to grasp easily especially for new beginners. I wish more and simpler examples or sites’ names of digital notes related to the topic be included in the module in the future for further clarity.
I was encountered with a problem to download ‘The Che Tao Nature Reserve boundary’ from protected planet. But with the help of our mentor Dr. Lucy, I succeeded in adding into my QGIS project.
Wow awsome work, your map looks great and all your layers are clearly visible and easy to understand, your effort has really motivated me to go and try what we have learned so far with my own field data.
1 Like
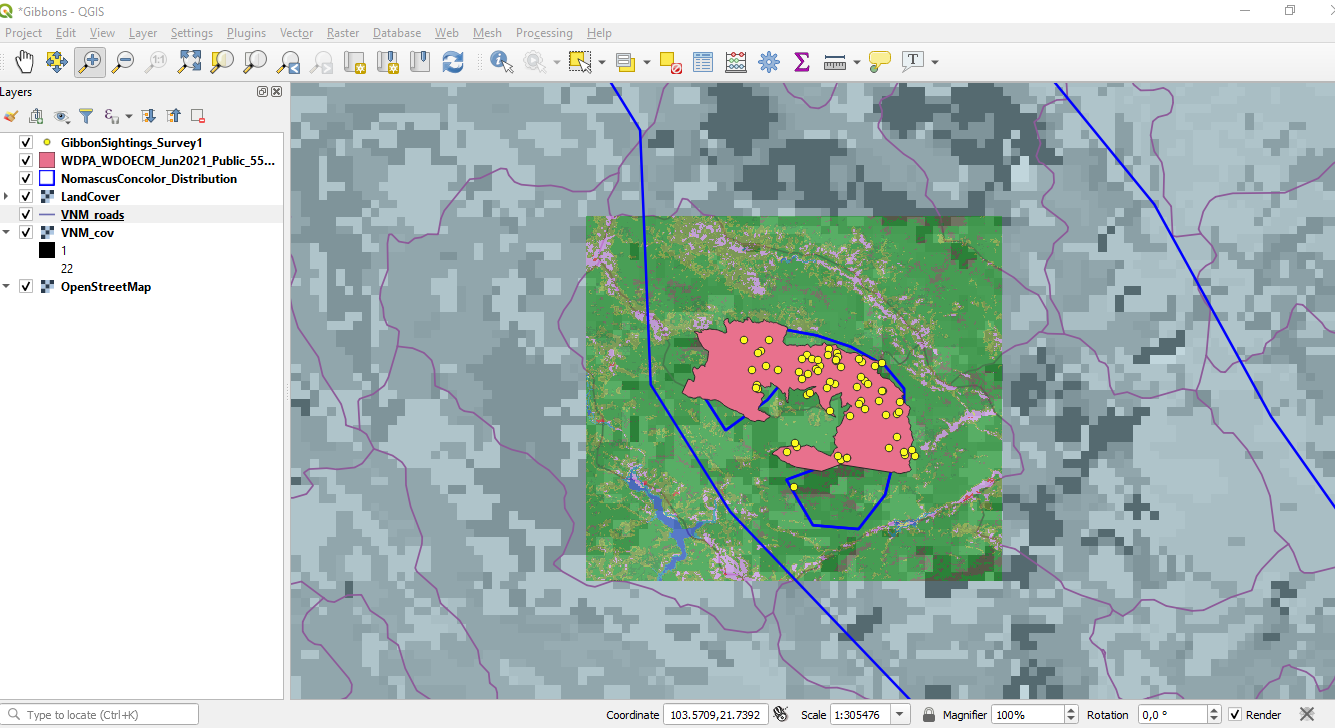
This looks fab, keep up the great work! I made my VNM_ Roads lines wider so that you can see them clearly when zoomed out