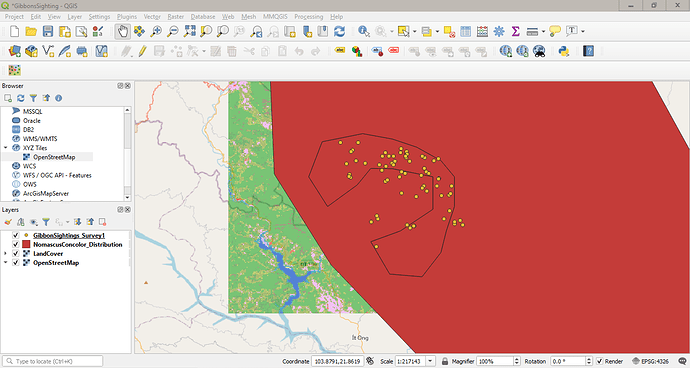
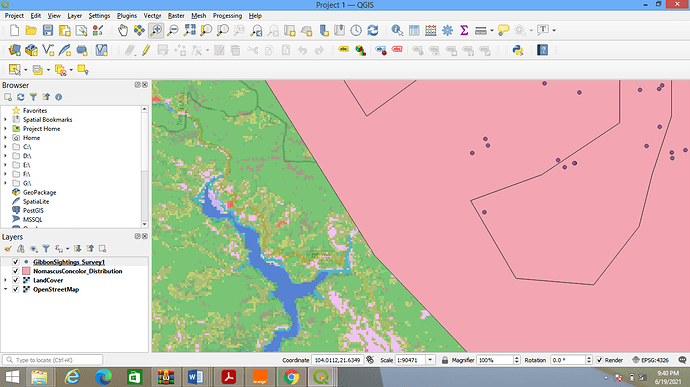
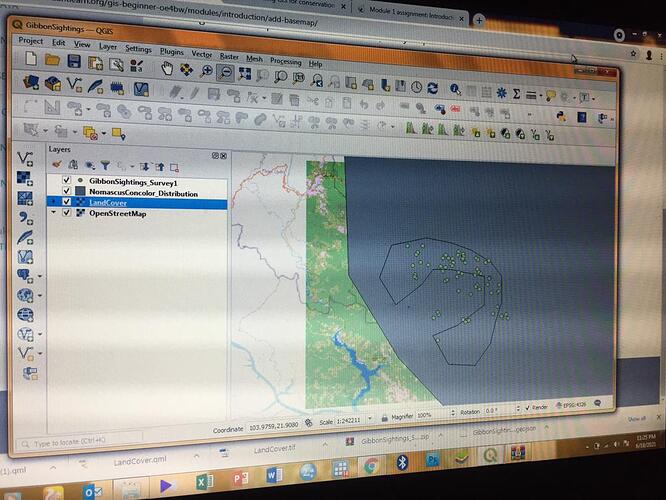
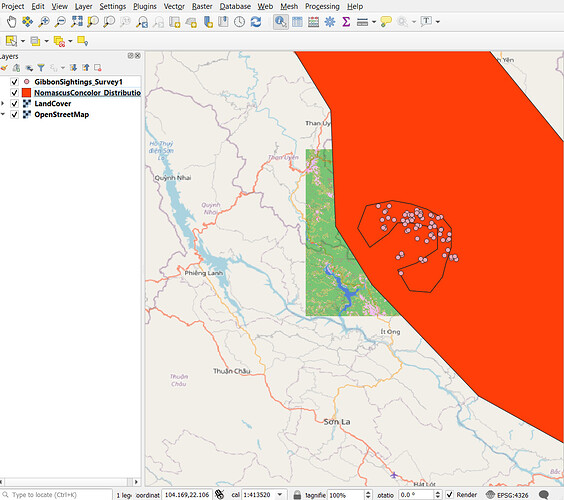
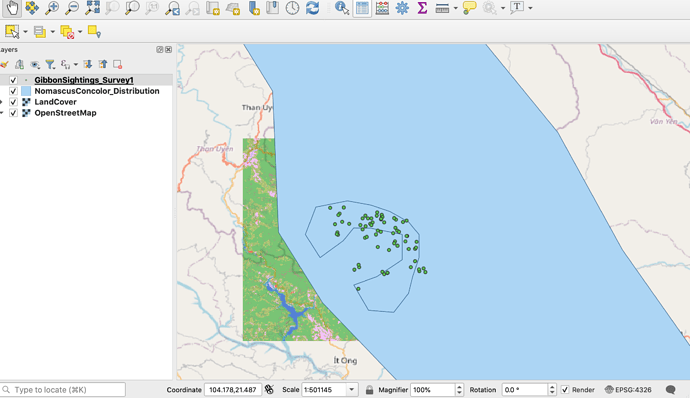
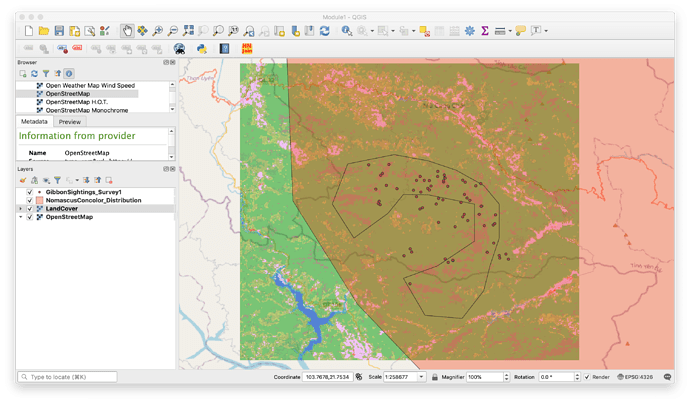
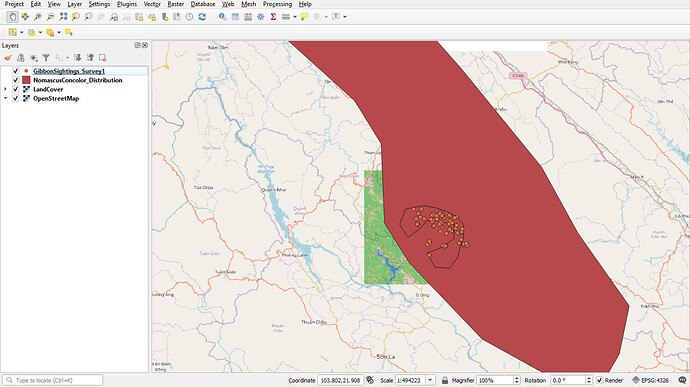
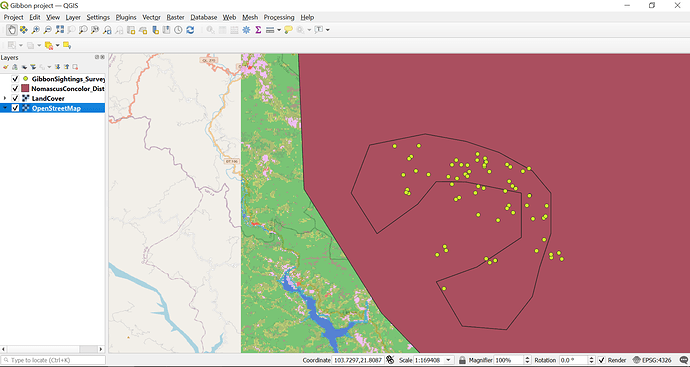
What information did your data had? And how did you put your data in file
I used the data provided by the course. I believe further modules will help us create our own data sets.
Hi Jpastrana4, ArcGIS and QGIS can produce very similar (infact identical if you choose the right options !) results from the same datasets and if you have data in a common format like Shape (*.shp) files, can use the geospatial data interchangably. I use both on a daily basis, swapping between the two depending on what I need to accomplish. Both have their pros and cons and both have functions they are more suited too, so its worthwhile getting used to both of them, and if you have both available, then its good to use the one most appropriate to the task in hand. My own conclusion of using both software packages for many years is that ArcGIS overall hangs together better, is more intuitive and the workflow is more consistent, but QGIS is free (ArcGIS is very expensive!), and has many tools and plugins available to increase its functionality. A license for ArcGIS also includes ESRI’s online tools such as storymaps and ArcGIS online allowing web based mapping applications to be very easily developed.
This module is clear, easy to digest and fun to follow thorough. My only problem encountered is when i tried to add basemap into my project. Under the layer from panels, there is no option for Add XYZ Layer but I managed to add the open street map through XYZ tiles in the “Browser”.
The module was quite easy to do. It was really interesting to do. Learning to add layers and changing way the were arranged initially. Otherwise the task was basic and enjoyable.

There is no doubt that this module had served as an eye-opener as regard what to expect in the coming weeks. Each activity in the module comes with its uniqueness, giving me the platform to learn the sequence in developing a map of this sort. While I am getting used to basic tools, there are some basic issues which if addressed will serve a better purpose for me:
- The Gibbon data for species distribution was saved in five formats; .cpg, .dbf, .pgj, .shp, .shx. Are these formats the required formats for use in QGIS?
- If I am not using the Gibbon sightings data and decide to utilize my own distribution data which is basically in excel format, can I convert my excel file directly to the above formats or I convert to a “.csv” file prior to input into QGIS?
- Are Landcover images free to access? If YES, how?
- Lastly, I observe our base map was obtained from the link- https://tile.openstreetmap.org/{z}/{x}/{y}.png. Is this a specific link for this purpose or it can serve all purposes after now.
I did not encounter any serious issues. Issues were minor and I could easily follow basic steps to solve them
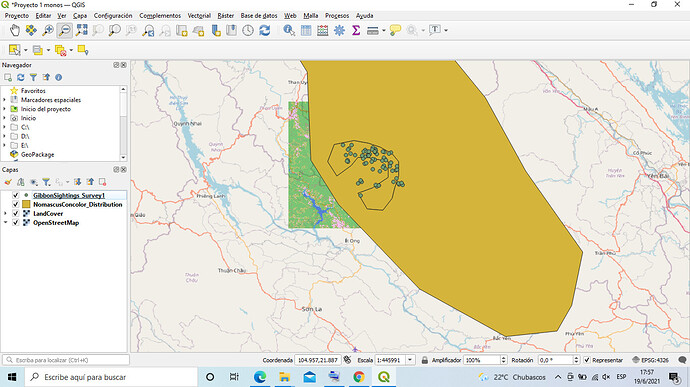
Hola a todos!!! Here is my work!
I really enjoyed the first module. My English is not the best but I could understand all the instructions and that is great!!
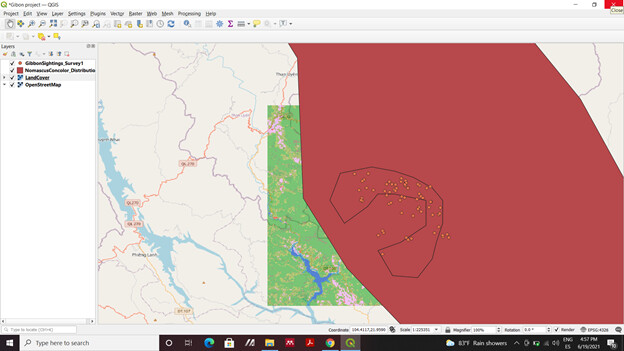
Hello Tshiwa. Fantastic to see such a great output for your first module assisgnment 

That’s very true. Nice output from your end 

Hola Victor,
Oh, Thank you!!!
This was my first experience with this program and all the instructions were easy to follow.
I don’t have the best English level and even that, was possible for me follow all the process.
I hope to learn how to generate the different files that we use.
Nice job! Did you find how change the color of your layer?
The course was surprisingly easy to follow and is great for a beginner in GIS. This is a plus since in remote learning it is always not possible to get questions you have answered right away.
I had a problem with my OpenStreetMap layer not showing up but then I solved it by removing the layer and adding it again.
As a GIS beginner, I found the tutorial very easy to follow and had no issues with importing the files. At the end, I did had some fun playing around with colors of the layers.
I also agree! It would be nice to know how the files are generated.
This module was very easy to follow! I have used QGIS before and had a bunch of toolbars and panels open, but I turned them all off except the ones selected in the module. After I did this though, I had issues adding a basemap (Layer-> add XYZ layer wasn’t showing up). However, I found the panel that I normally use and turned it back on in order to add a basemap!
I also had this issue and then solved it the same way you did, I wonder if it could have something to do with already having an XYZ connection set up? I had used QGIS previously, and so had already set up XYZ tiles.
The instruction is very easy to follow. Thank you very much. These activities have contributed to progress towards my learning goal especially when adding the basemap to the species distribution data. It helps me to situate where in this area my species is distributed and hopefully in the next module I can explore more about the area where they are distributed.
Hello, here’s my screenshot from week 1!
I found the module quite easy to follow along as a first time QGIS user. I find it quite helpful to equate some things to Photoshop (as I have some basic experience with it). Especially where the layers are concerned, and arranging them to properly view the data. Also customized the colours by right-clicking and going into Styles.
