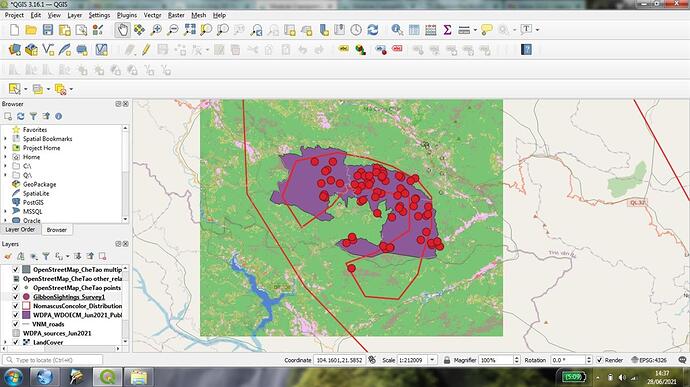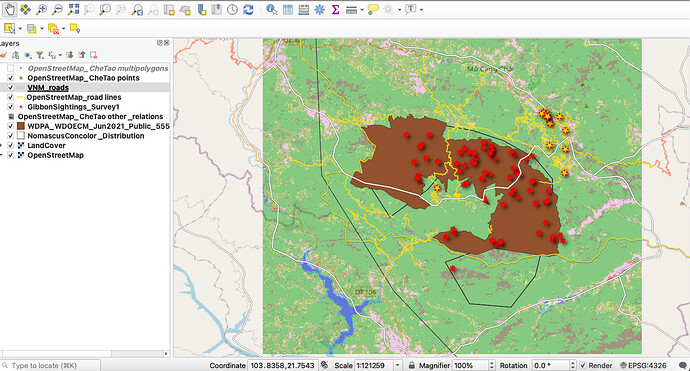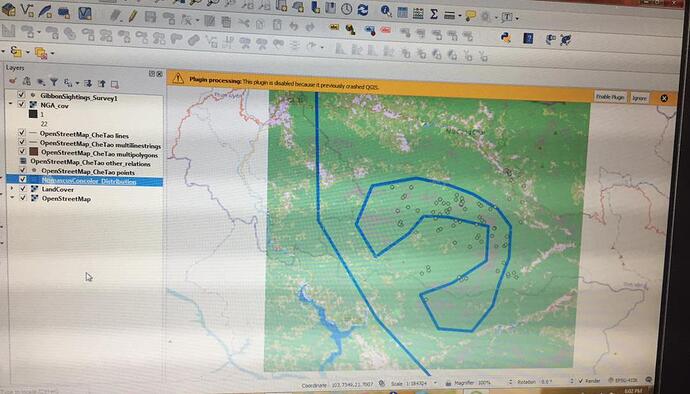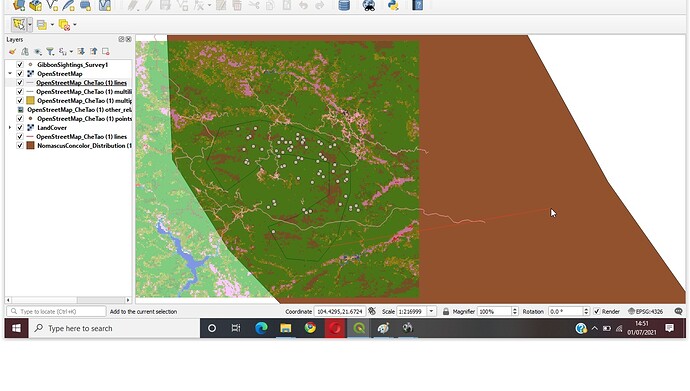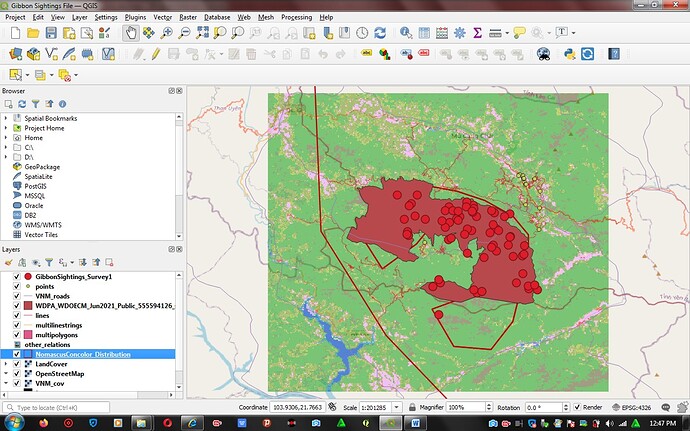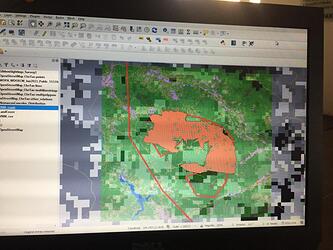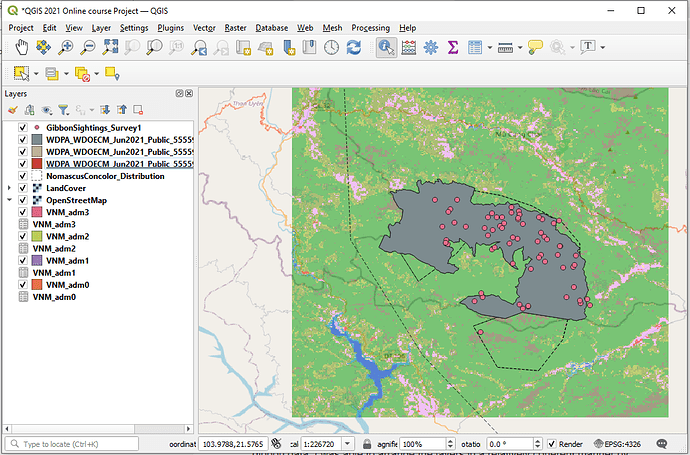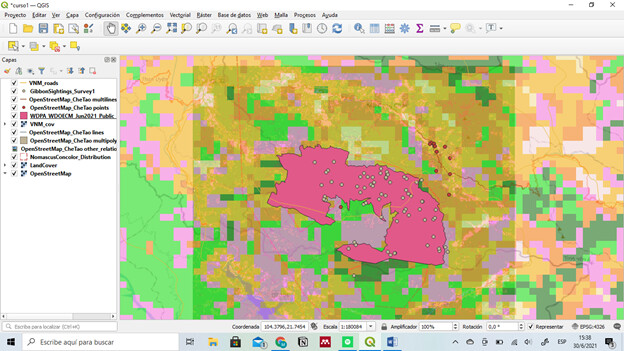
Well…I felt the difficulty more in this module, so I don’t know if this is what is suppose to look like. It was very useful to know all the concepts behind vector and raster data, although it was difficult to put all the data together for the example and compare the resolution and extant.
I don’t know what you’re missing, actually I see you have all the layers showing but the map looks very organized unlike mine. What was your criteria for organizing the layers?
The result! I have a mac and it took a while. QGIS kept crashing. I found the instructions vague. Took me a bit to understand what each file was supposed to mean. It would help to be more descriptive about what each file is supposed to be. The attribute tables for the file don’t really tell me much. It was fun playing around with the order and colors. QGIS has so many updates! I just downloaded the 3.18 version last week and now it wants me to download another version, 3.20. I’m finding this is indeed a skillful artistry and not just science.

I like the colors, they indeed standout! I found this week difficult as well. Trying to figure out the order of the files and to layer everything to depict each detail was hard to decipher. I think what would make this even more detailed is to get those roads poppin as well. I think there are 2 road files (general map and then the vietnam map), you could probably give them thicker lines/contrasting colors to see where they layout on the map.
Thank you! That really helped 
The really interesting thing about GIS in general is its a combination of applied sciences and artistic creativity (that is where the “cartographic” aspects come in to get a “nice” looking map that also conveys correctly the aspects of the science you have in the geospatial data.
Good job…but how did you input the smaller map in the image…I didn’t get that for mine and I followed every instructions without hiding any layer
Here is my assignment …am not sure I got it right though because I had some difficulty arranging the layers and understanding the instruction…but this module was helpful because I now understand the difference between raster and vector and their types.
I did not get the smaller map too…I tried everything possible…followed the instructions but couldn’t do it right …can anyone help with that?
Here is my Model 2 Assignment and For me to adding the symbology and the colour at the end of on my PC does not visible the word ,Apply , how can I doing?
Wow this is beautiful
You can use the “maginifying glass” icon to zoom in and out or right click on a layer to zoom to that layers extents or use the “scale” box at the bottomg of the screen to alter the display scale. All of these allow you to alter the scale (and therefore size) of the map displayed.
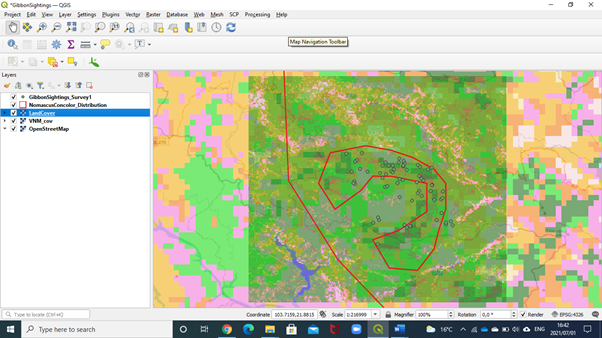
Thanks to Dr Lucy , I now have a picture of the difference between the vector and raster data , I am so happy that i have reached the last stage , though i am not sure whether i did well on this exercise . Thanks to her again , i now know where to access free datasets for practice sake in future .
It seems like there some layers missing here ,like WDPA WDOECM Jun2021 shp
After a challenging week, I feel a sense of accomplishment. Thanks for this exercise though i have to submit late due to some difficulties in understanding the assignment but now i can now describe Raster and vector data models with examples, Adjust the symbology of vector layer which was interesting doing it.
Thanks to Lucy
Best Regards
I also faced this challenges with zooming in and out but i unchecked all my work and mark one after the order which gives back the perfect look. Also i close and reopen since i saved my work already
Sorry for the delay but thank you for letting me know this 
