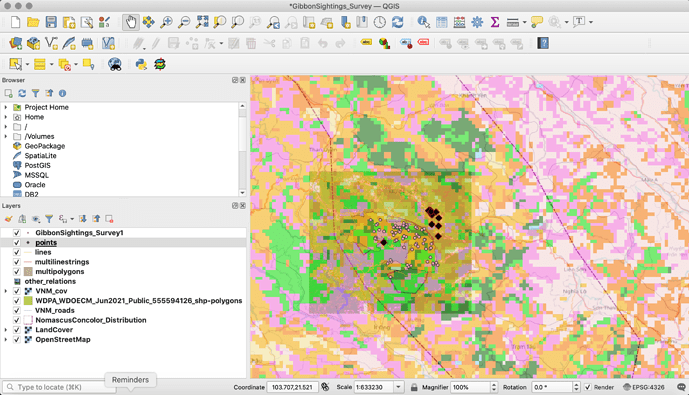
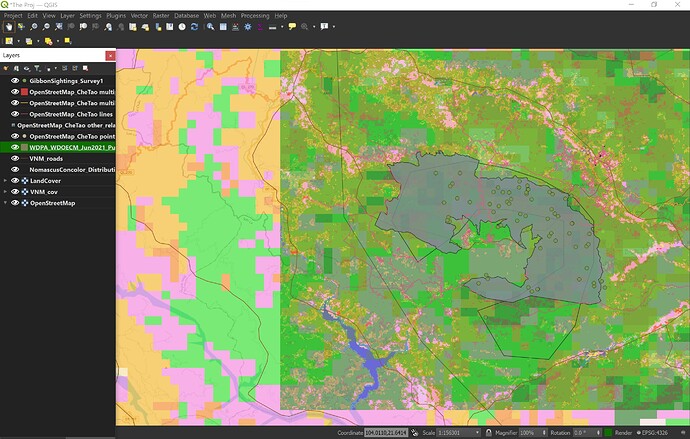
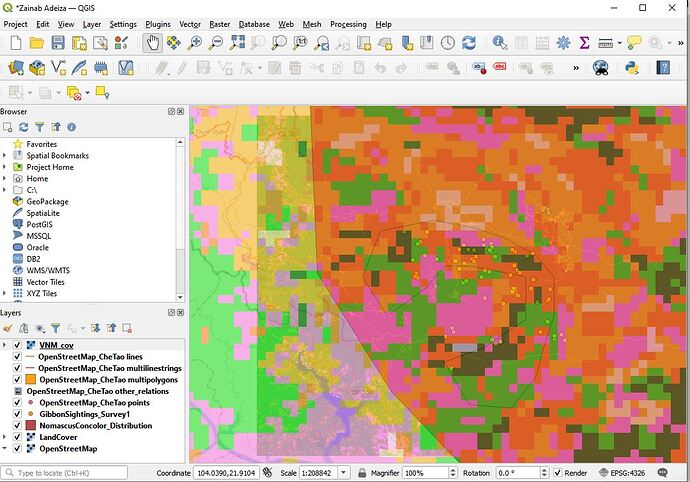
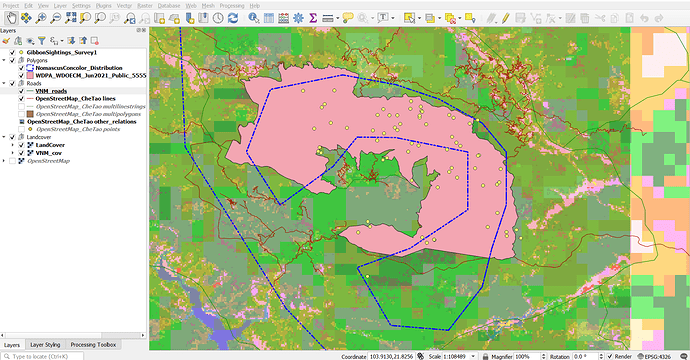
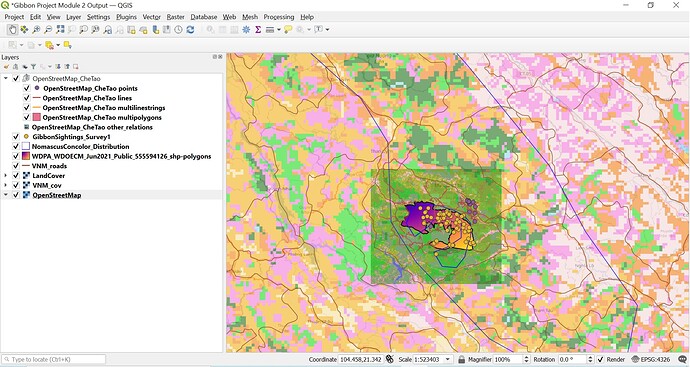
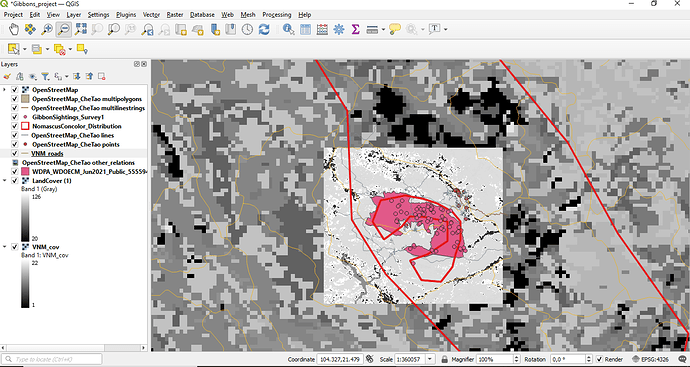
Hello, I think I know how to do this! If you double-click on VNM_cov in your Layers panel, it should take open a Layer Properties pop-up. Then on the left side, you can see “Transparency” on the menu below “Symbology.” There’s a sliding bar where you can adjust the transparency of your VNM file. This is what I did on my screenshot. Let me know if this works!
I finally understand the differences between vector layer and raster layer. Was wondering why there were two types of layers and when to use them, and this module answered my questions.
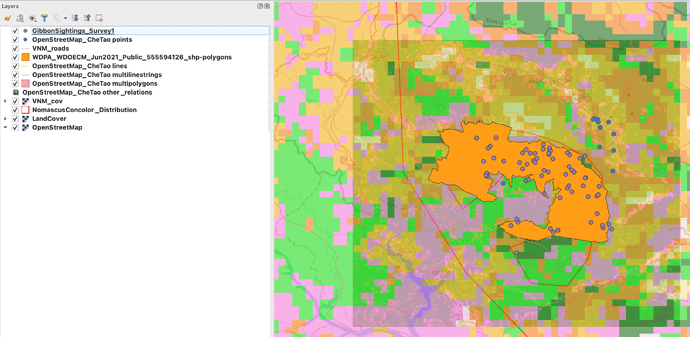
Tried my best to arrange the layers to showcase as much information as possible without it being too messy. Not sure if that worked  I’ll keep trying!
After completing this module, I finally understood the geoespatial data model concept and the differences between vector and raster data. I didn´t have any problem for to make the map. It was helpful to make the comparison between low and high resolution image, also the examples indicating the differences.
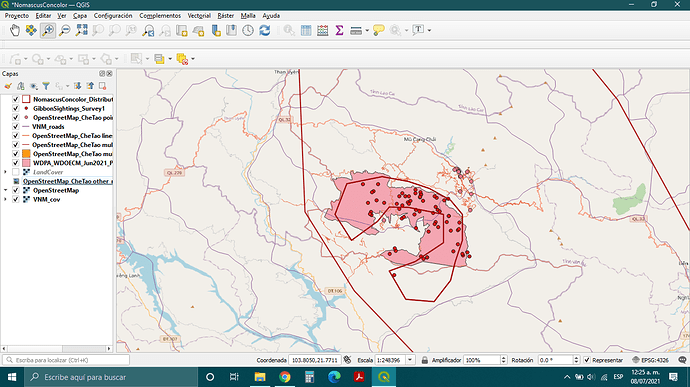
PS.I still have doubts when arranging the layers, Wich goes first, points, lines, poligons or layers raster?
Looks like your making progress 
Long file names are definitley a problem in GIS in general (trying to make them meanignful and short is always difficult!). However, you can always rename the layer in the “Layers” panel by right clicking on the layer in question. Remember though that this is only altering the “display name” in the QGIS project , it is not altering the name of the actual source document, but is a way of “tidying up” the layers panel.
You can also “Group” layers together under a shorter “Group Title” and “contract” the group by clicking on the “-” icon next to the group name so only the top level “title” is shown.
I learned the difference between the geospatial data model, the difference between resolution and extent, and learned about uncertainty. The discussion on uncertainty was quite interesting. I initially did not know how to use the qml file correctly in my project, but I was able to figure it out.
I think you did a good job managing the layers. Your screenshot looks like mine before I used the .qml file correctly. You might want to put the .qml file and the .vrt file under the same folder and import the .vrt raster again. My understanding is that the qml file will assign the raster nice color-codes.
In this module, I learned the difference between raster and vector data models. Also, I learned how to adjust the symbology of vector layers. It was very interesting to me to work on data from Vietnam!
Whew! This module left me wanting to learn more about organization and understanding what files I’m plugging into the system… My project feels very chaotic at this point  .
.
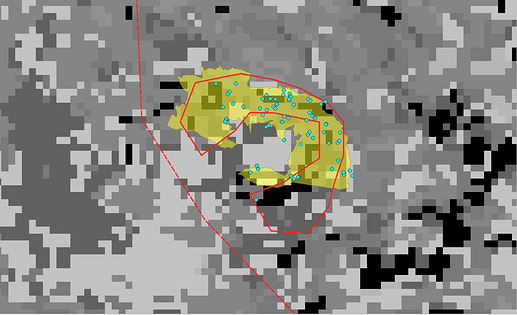
However, it is very easy to visually see the differences in resolution in both landcovers and polygon outlines (hopefully I’m using the term resolution correctly here?).
You’re definitely right haha. Stopped using gradients cause it go all confusing. Only using it now for the che tao reserve boundary
Clear representation, nice work. Agree with needing a bit more step by step instruction!
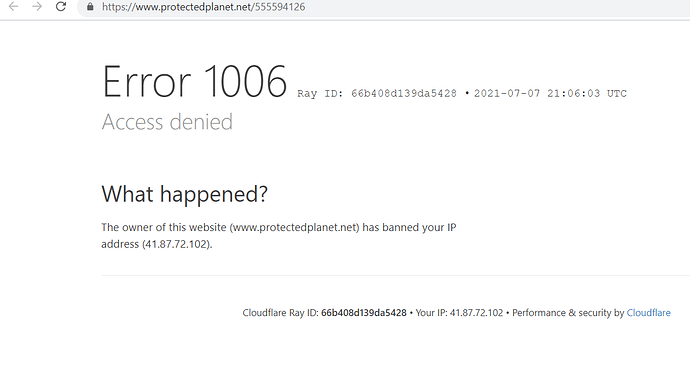
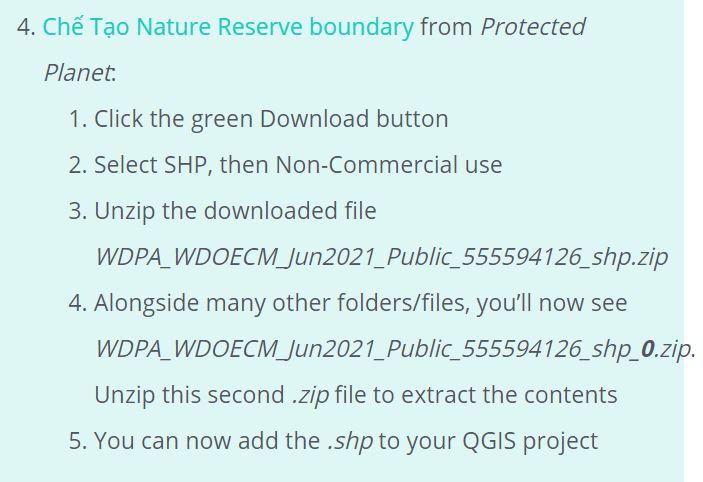
Module two was very easy to understand but I had difficulty in carrying out the tasks (From the fourth point) because the link won’t open (Access denied). I am based in Nigeria and I don’t know why that happened. Also, I have been unable to get help from the community even though I sought help.
Here is my progress so far but I will like to go back and complete the task if access can be granted. Thank you.
Well done… We are indeed learning a lot.
I think the instructions were deliberately vague in this module to get us thinking. I was a bit confused too but I was able to figure it out after a while.
Your map looks very good. Well done.
In this module, I finally understood the difference between vector and raster layers! It was a bit difficult to grasp the differences between thematic and continuous raster data, but with the examples I think I got it at last. I now feel more confident in identifying and selecting the correct geospatial model to represent my data and I’m excited to keep exploring the tools QGIS has! 
Hi! I really like the colors you’ve chosen, they go well with each other and also are different enough to recognize the different attributes you’re showing.
Regarding the order of the layers, they are shown from top to bottom, so I would suggest starting with the sighting survey, followed by the distribution and reserve maps, then the roads, the landcover, and putting your basemap last. This way you’ll be able to show all the different layers you’re working with. I also found it usefull to create groups for my layers. You can do this on the “Capas” panel, the second button from left to right.
Hope this helps!
Sara.
This is my output. I don’t know if this is correct. Please do comment for me to improve.
Thank you for this course, I was able to identify raster and vector. I was able to organize my datasets in order to visualize it properly. Although i have difficulty on following the instructions especially on downloading the datasets but through asking peer’s help i was able to do accomplished the module assignment.
Yes, its true i also experience confusion same as you. The instructions needs us to think critically especially in its organization. Congratulations for the job well done in this module.
It’s great how you explored and put in different colours that made it easier to see the map details. Well done.
I am new to GIs learning but m getting there. I took me long to fishing my project cause I was finding it very difficult to open some of the files. I have learned how to sport differences in types by viewing my map and how to analyze it. I have learned that to master GIs I need to practice it now and then for me not to loose touch and how things are done. Practice makes perfect.
Your work looks neat I like the way you played with colours they blented very well.
