Thank you maybe for that reason I couldn’t include the boundaries of the reserve in my map. I didn’t find the .shp file.
I struggled with finding where the instructions with steps were. I then used my knowledge to add and play around with the layers as seen with screenshots from others.
Hahaha, I also had 5/7 in the second quiz  lovely work @Sumbede_Anthoine, well done!
1 Like
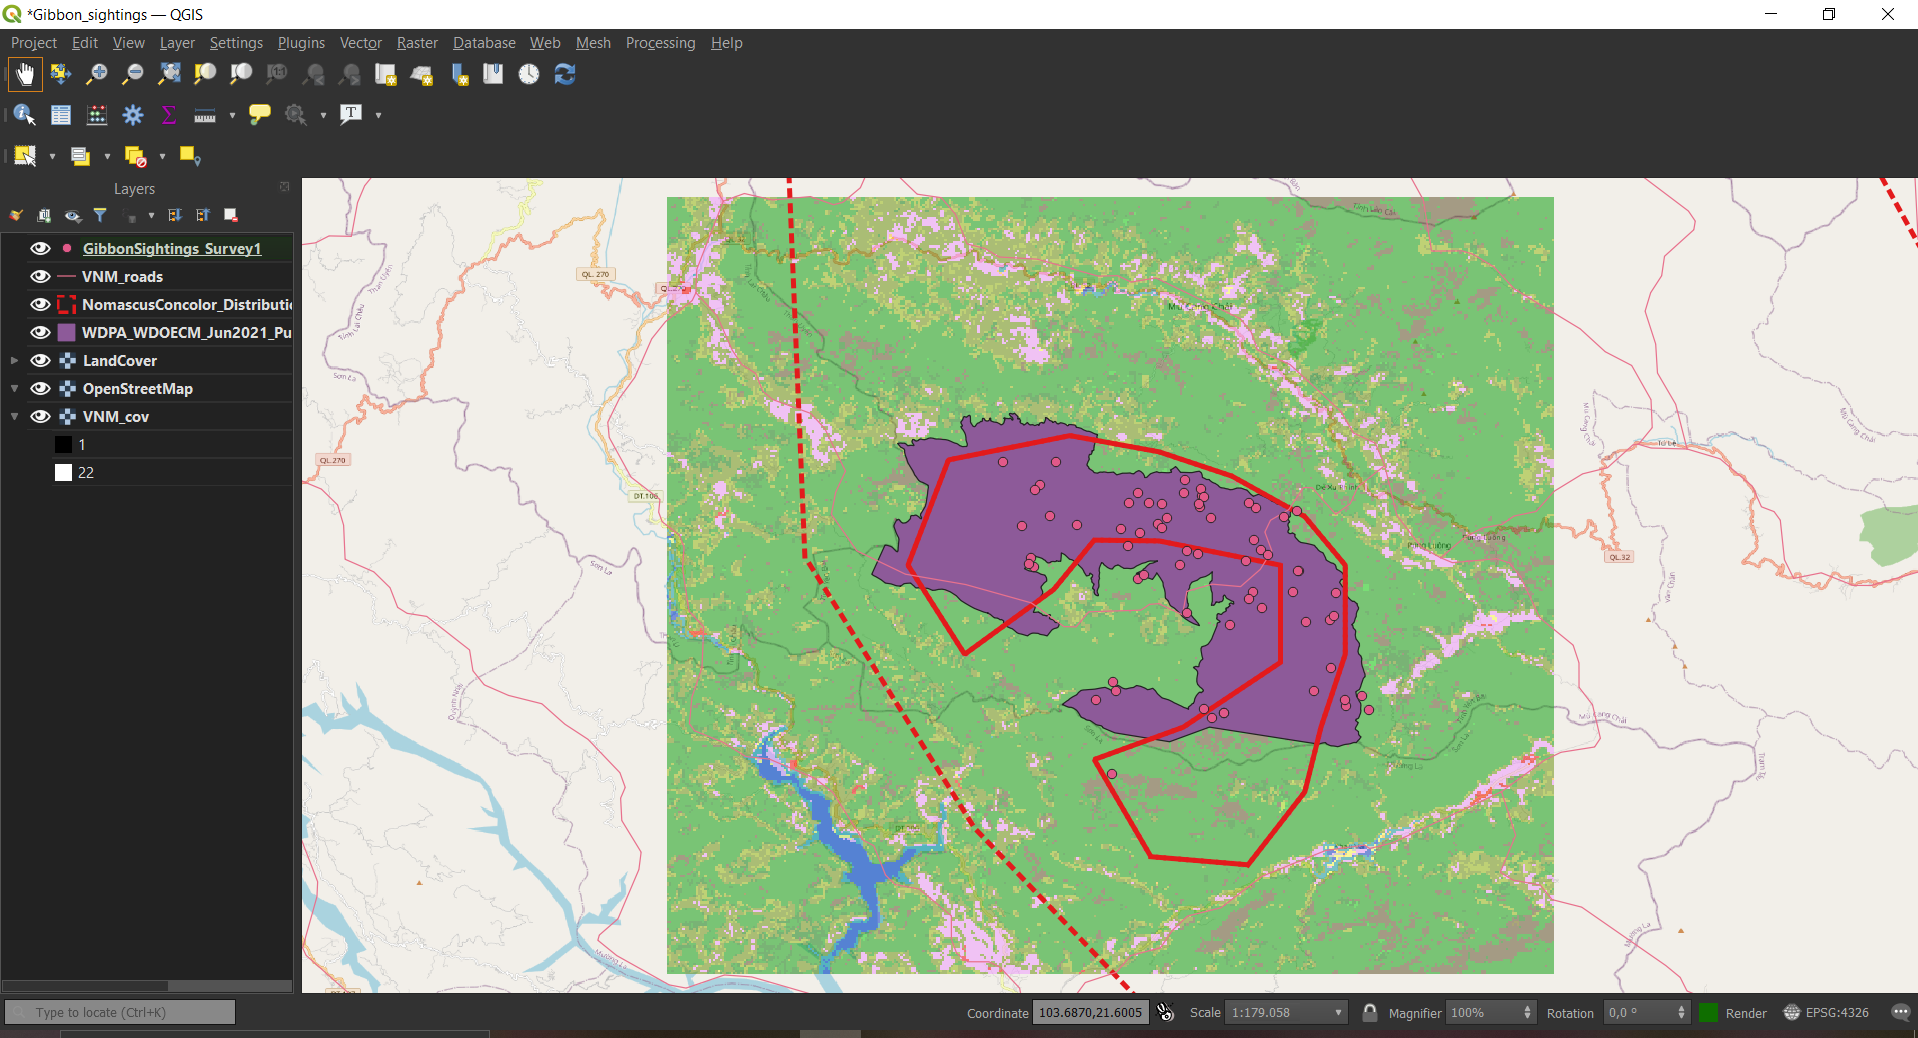
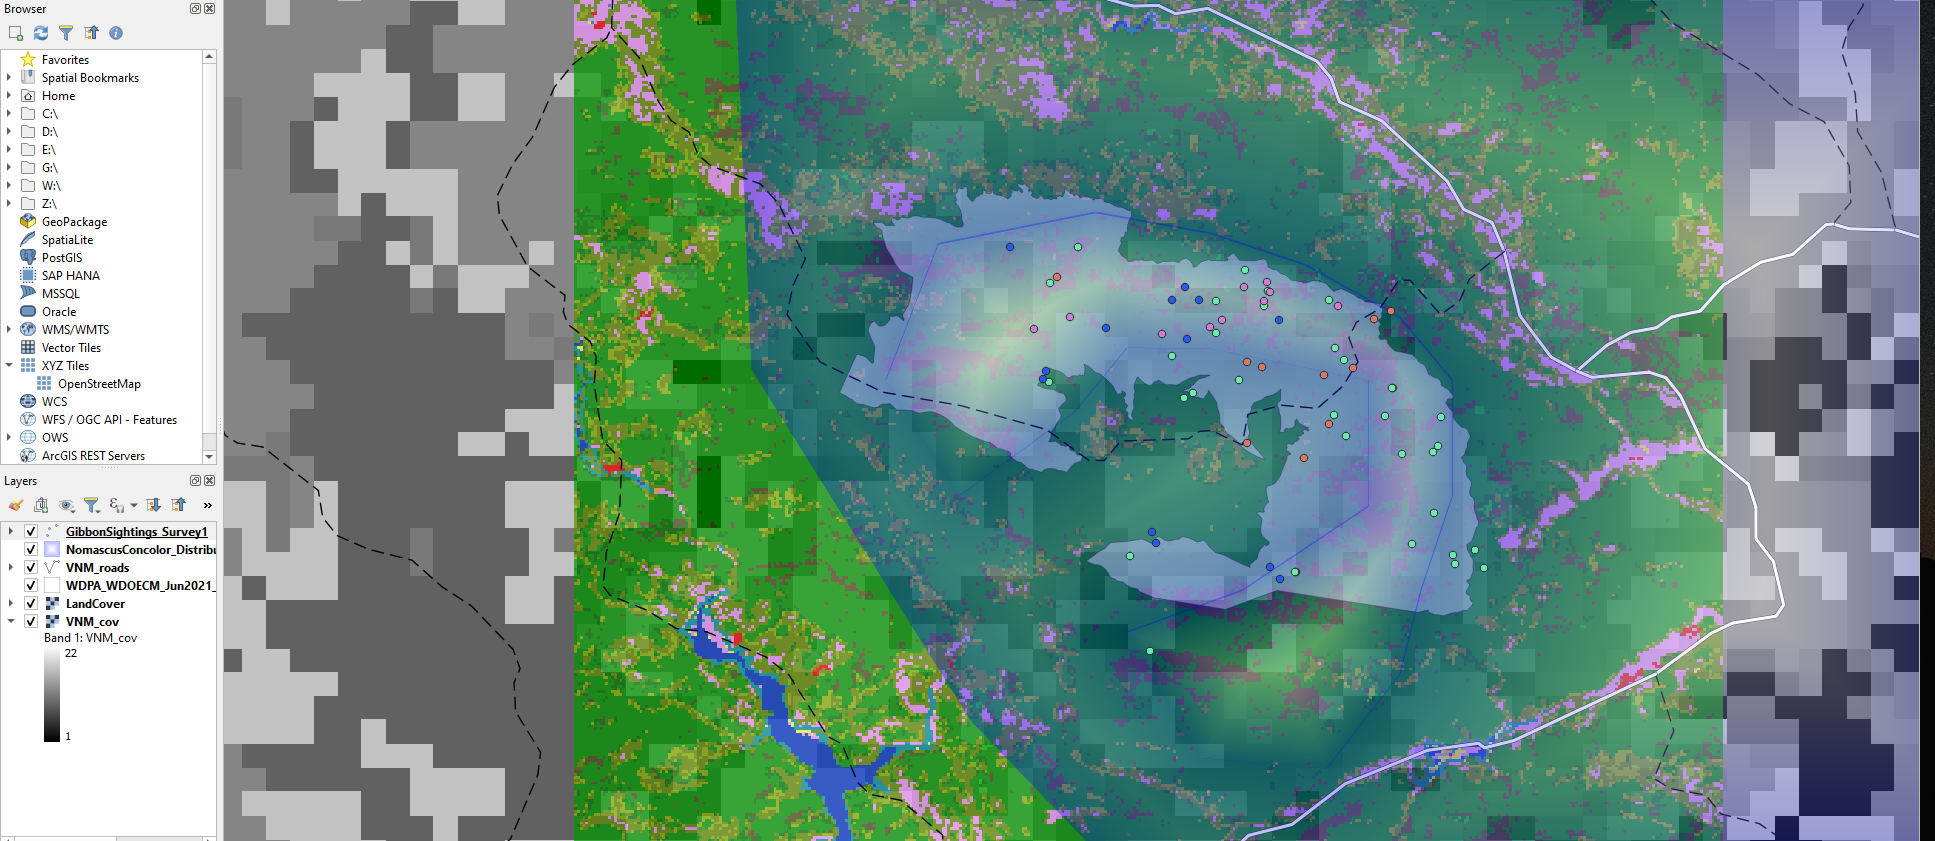
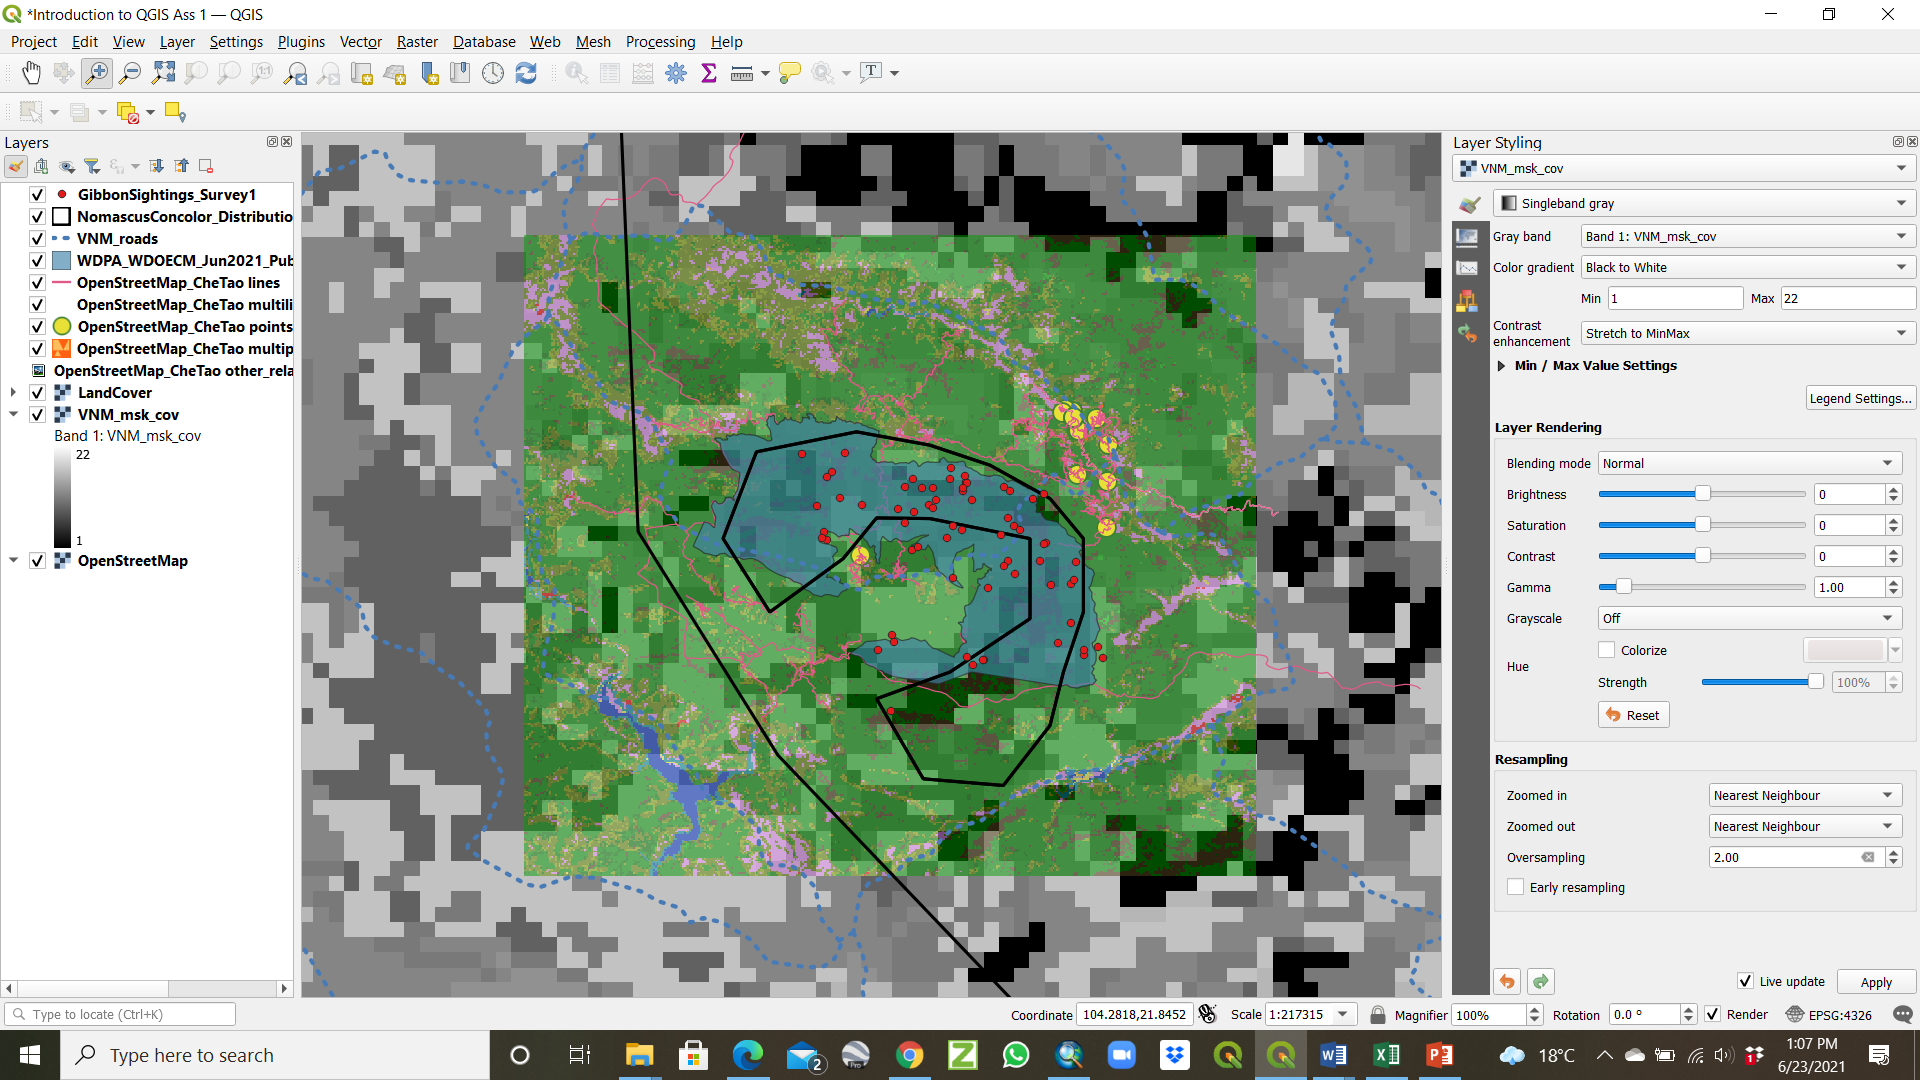
Hi Syn, I’m a complete beginner here, so I’m not sure I can give advice, but maybe it would be good to move the VNM_cov layer at the bottom of the list of layers? I personally find it really confusing at this magnification, so I preferred to show the OpenStreetMap and the VNM_roads files in my map instead, but maybe it’s just matter of personal preference - I’m not sure, need to learn more!!! Well done anyway 
Hi everyone,
this is my second assignment. Once again I found the module very smooth to follow and I learned a lot about how to represent data (even though I still have a lot of questions about how to collect data efficiently in the first place!!!). However, as other learners, I also found a bit confusing the part where we had to download several files from different websites, but I think eventually I was able to do things correctly (please let me know if you realise from my screenshot that I did not instead!) and to appreciate the difference between coarse and fine grain spatial data thanks to those files.
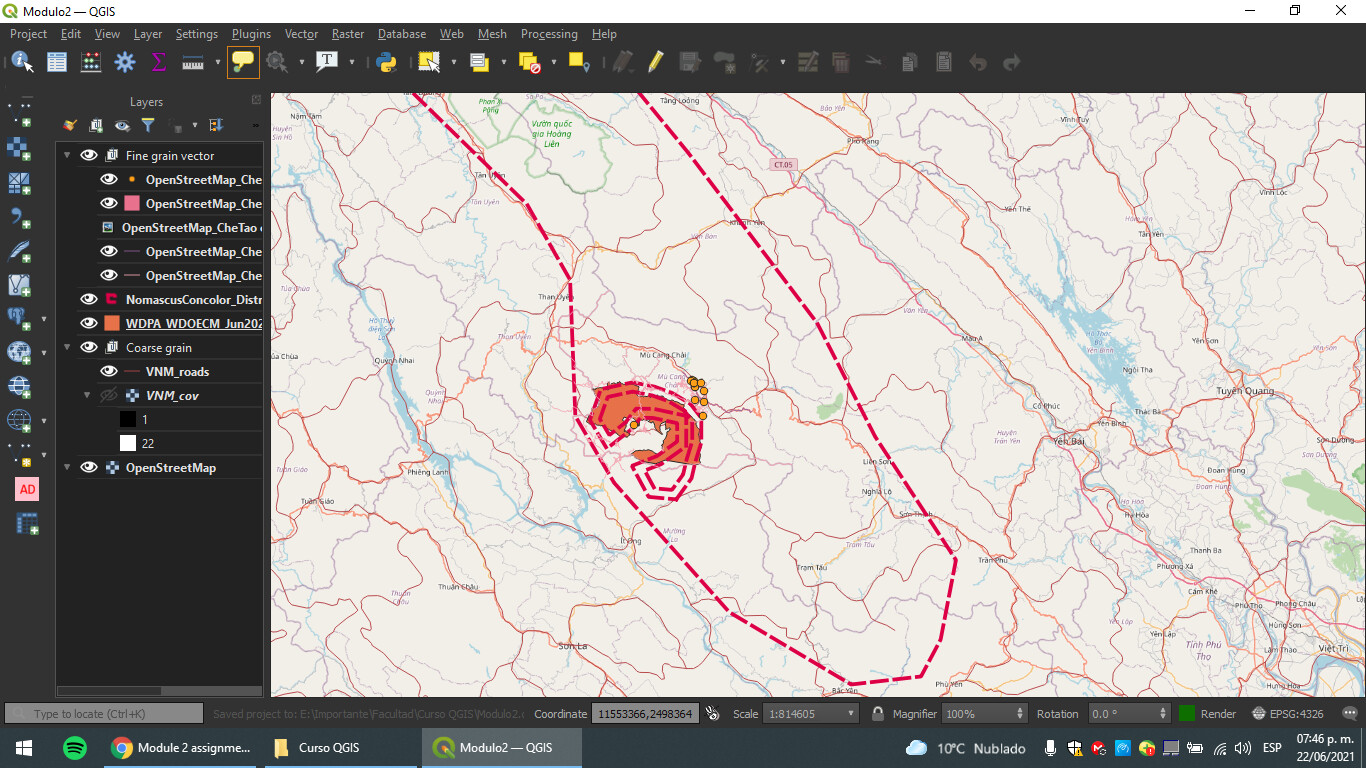
The task was easy to complete, but I messed a bit with so many layers, but I could organize them in a useful way. Also changing the symbols was very intuitive and I was surprised to find so many customization options.
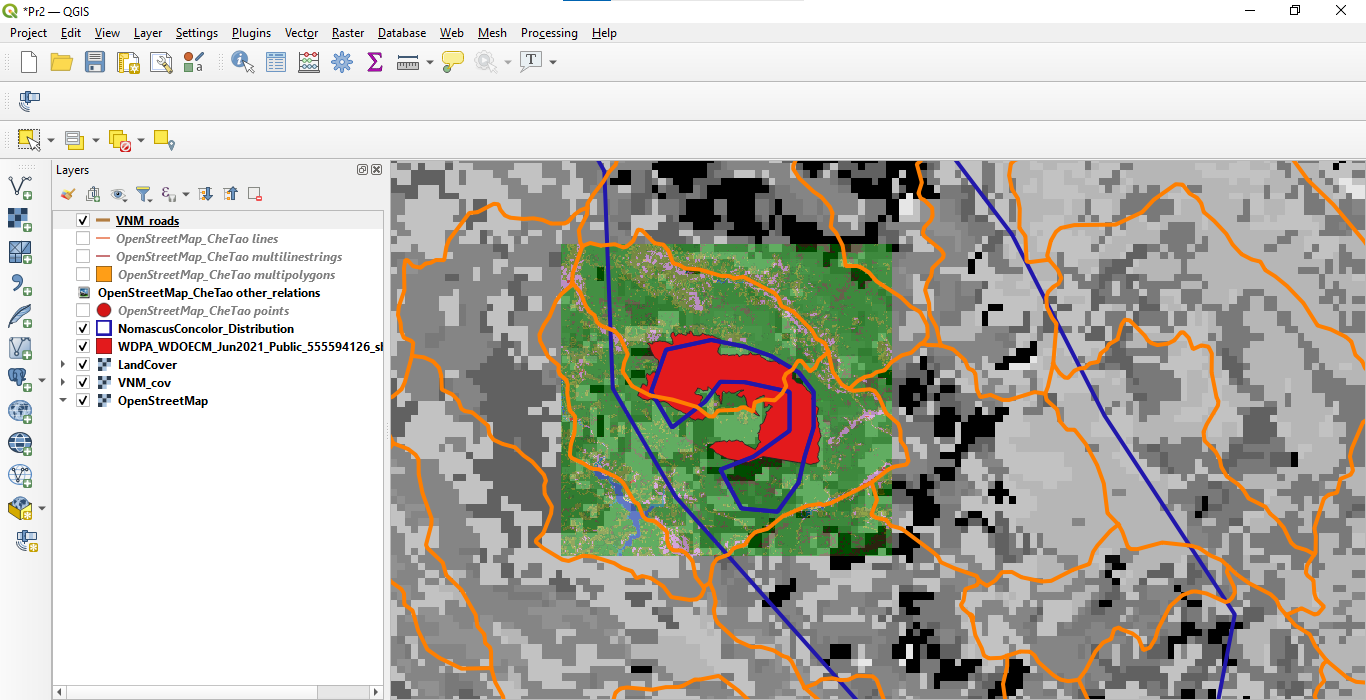
I found the most evident contrast in resolution between the Protected Area polygons and between cover rasters.
I had no problem with the tasks.
Hi! I had a bit of trouble with this too… that’s because the dowloade has two zipped files. I one you’ll find info in differente languages and in the other you have the layer files. You just have to unzipp both and import the .shp
Hi! Nice work! have you tried the “group” option to group and arrange the layers? maybe you’ll find it useful to keep the layer panel tidy and finding things easily
Again another easy and clear to follow instructions, although I find kind of confusing what to download. It’s hard for me to organize layers because I get lost between that much info. I find very hard to understand satellite images and rasters at the same time but it’s much more intuitive with simple line rasters, vectors and points. I also get confused when loading rasters and the type of file needed
 But I was happy to find differences between the different layers and what difference of resolutions look like
It does but looks great!
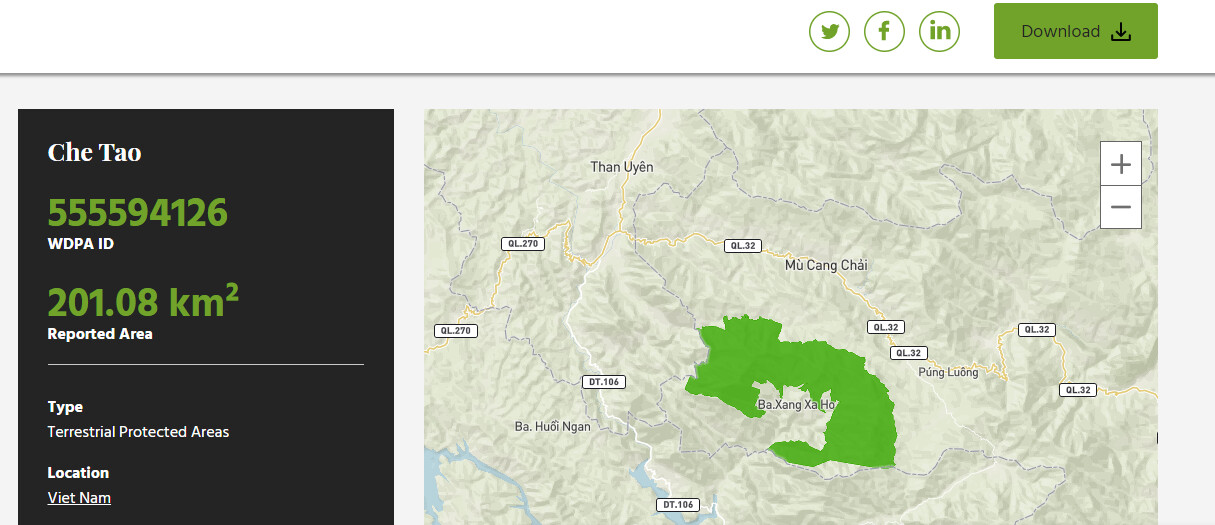
The link on the assignment it takes you directly to the file. The download button (green) is in the above right side of the website. I gives you different kind of files, you should chose “.SHP”
1 Like
I am learning more and more about layering, using different colors and fills and I think I improved quite a bit since the last assignment. It is quite fun trying to figure out the best way to display the data. I did struggle a bit with getting the reserve boundary to download and load in properly, but thankfully I was not the only one. The instructions were a bit vague , but I was able to figure it out for myself, thanks to the help of others’ comments. I also enjoyed looking at what others had done with their data and could draw some inspiration from those.
1 Like
Great job! I love how easy it is to see each layer here because of your choice of colors and fills. Your comments also helped me a lot when trying to download the reserve polygon, so thank you!
One suggestion I would have is to make sure to include the data points for the individual gibbon sightings. They may have gotten buried beneath one of the other layers. I had a lot of fun grouping my layers and reorganizing them so that I could display or remove them easier.
1 Like
I have worked on QGIS before however i have never worked with raster data so I found it very interesting to learn this skill. I am starting to learn the difference between vector and raster after seeing it physically with the two modules done so far, I am not certain if mine is correct, however judging from the others it seems to be okay.
WOW!
This is so neat
In this module, I understood the difference between Vector and Raster and the appropriate geospatial data model for my data.
Hi! Wow that was a lot of info to take in but broken down really nicely! Thank you!
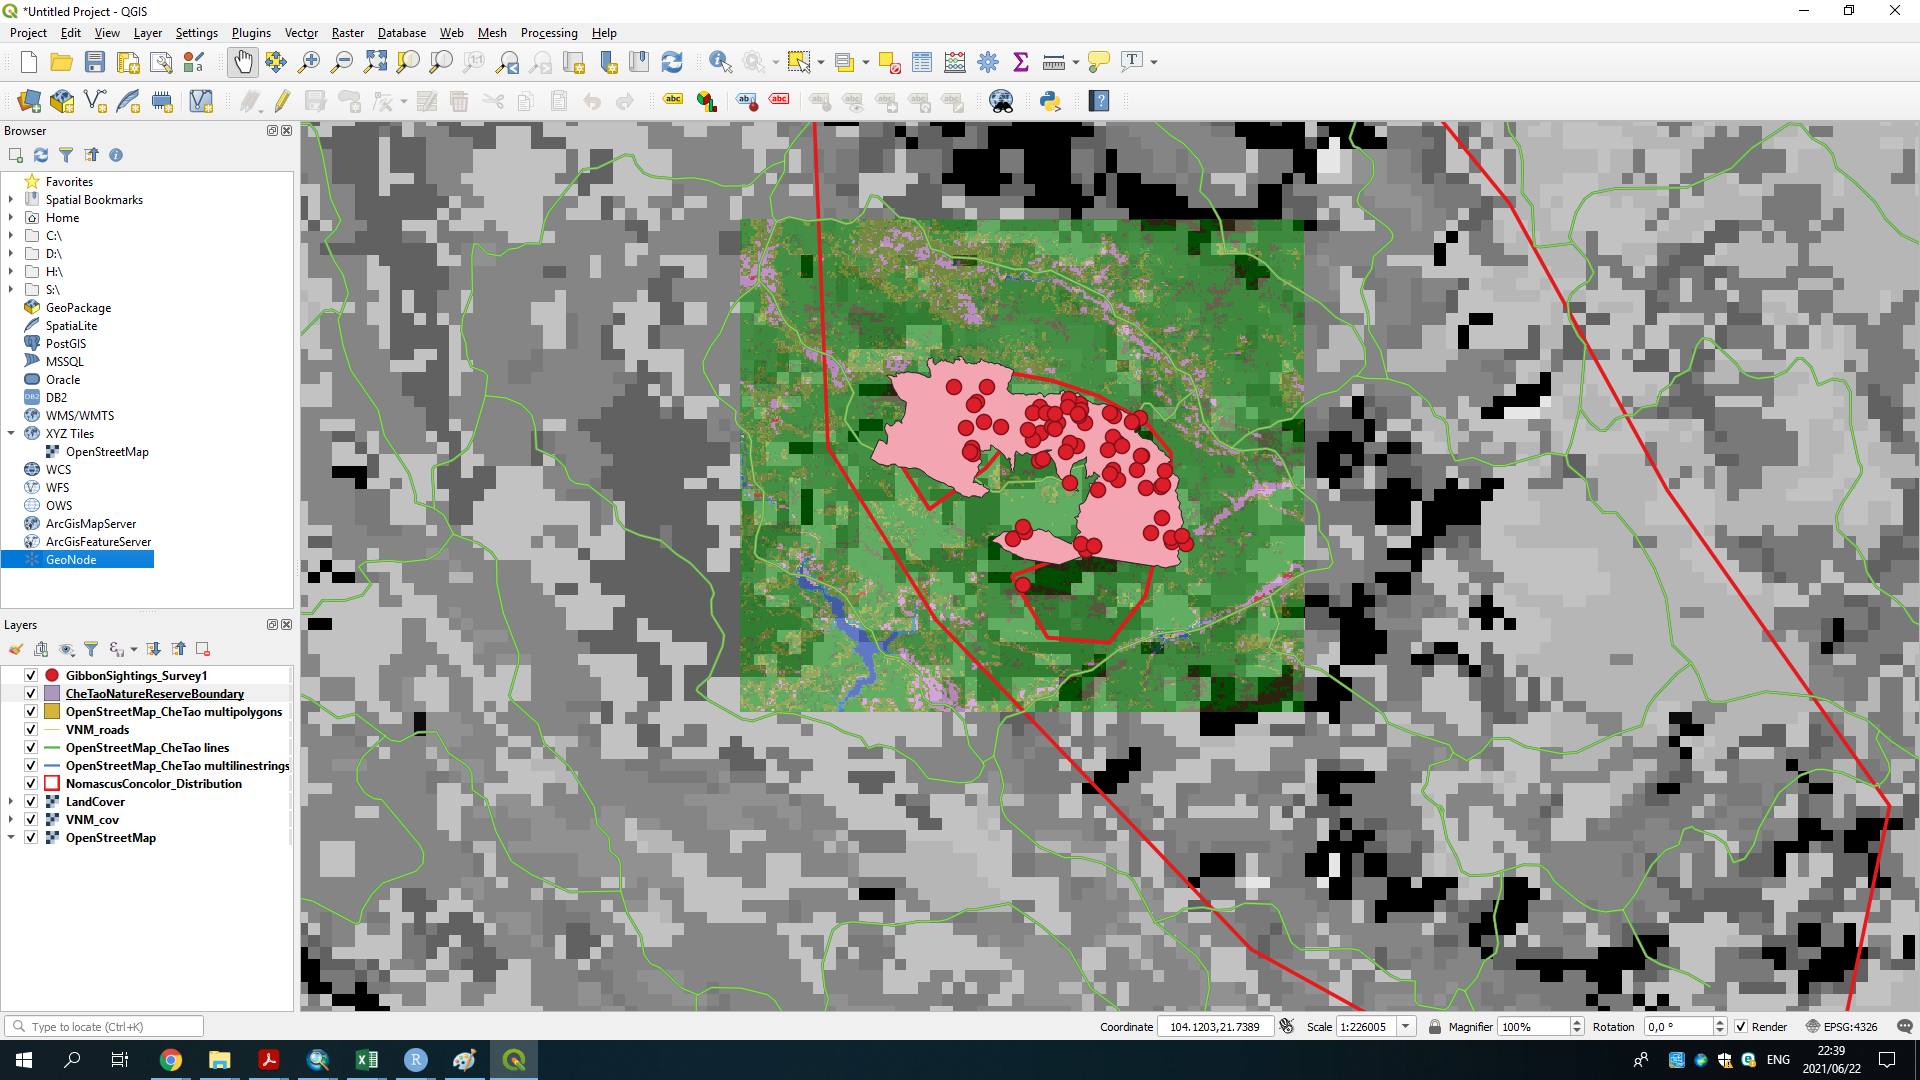
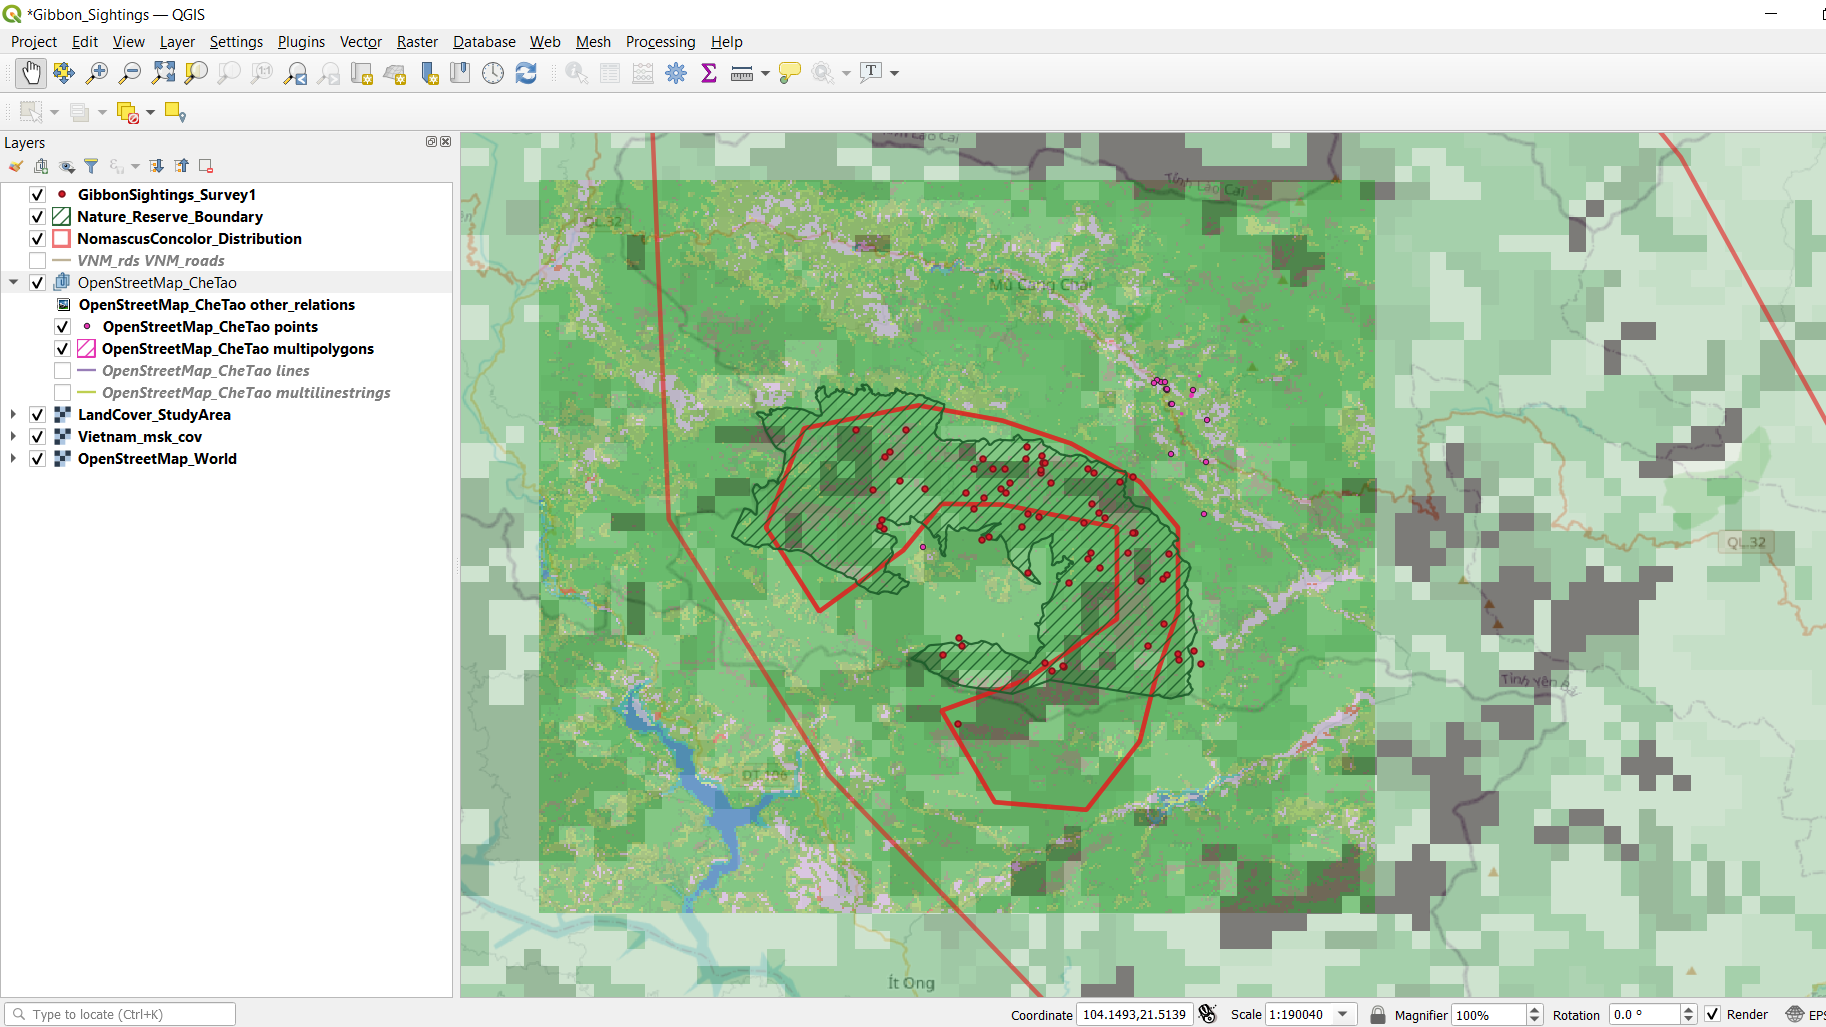
In this Module I think I grasped the difference between vertor and raster but it might take some more practice! I added the Che Tao reserve boundary as a vector layer - is that correct or should it have been a raster?
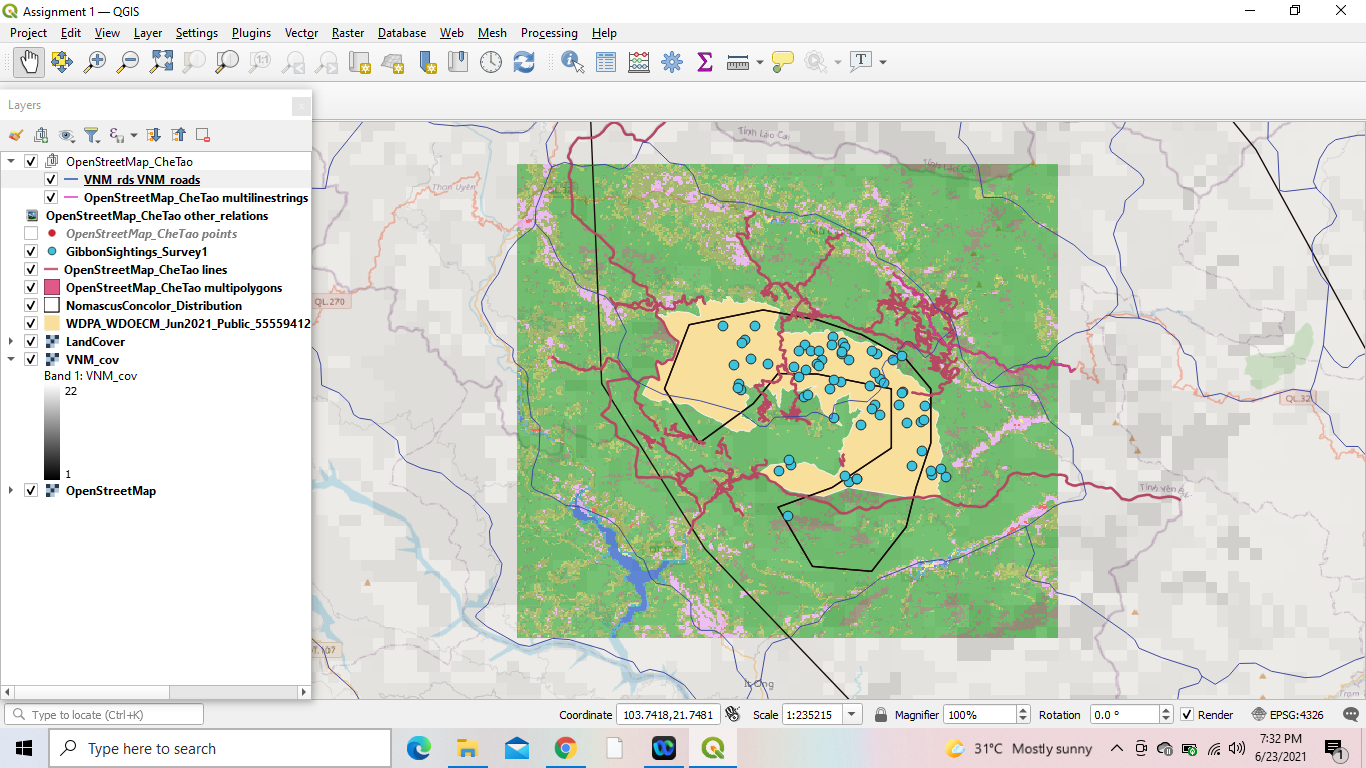
I am happy I learnt how to use properties to represent features eg. I made the roads black to stand out since they could be barriers to movement.
I did not like the VNM land cover data as it felt confusing to me - perhaps because it is low resolution?
I think next time I will be more careful about renaming layer titles and including their source.
As an aside does anyone know or have any thoughts on why the reserve boundary does not correspond with the distribution?
1 Like
Hi Hannah! I really like how easy to look at your map is and how integrated it seems! I think I will consider using the same colour for land cover from different data sets as it makes sense to keep that the same. The only thing I would change is perhaps one of the colours so that they are not all red to distinguish between the distribution and survey points. But otherwise it’s great!
I also had to figure out the instructions and re-read things a bit - it looks straightforward at first glance but implementing it is totally different! I feel like we’re all progressing nicely though!
Hi!
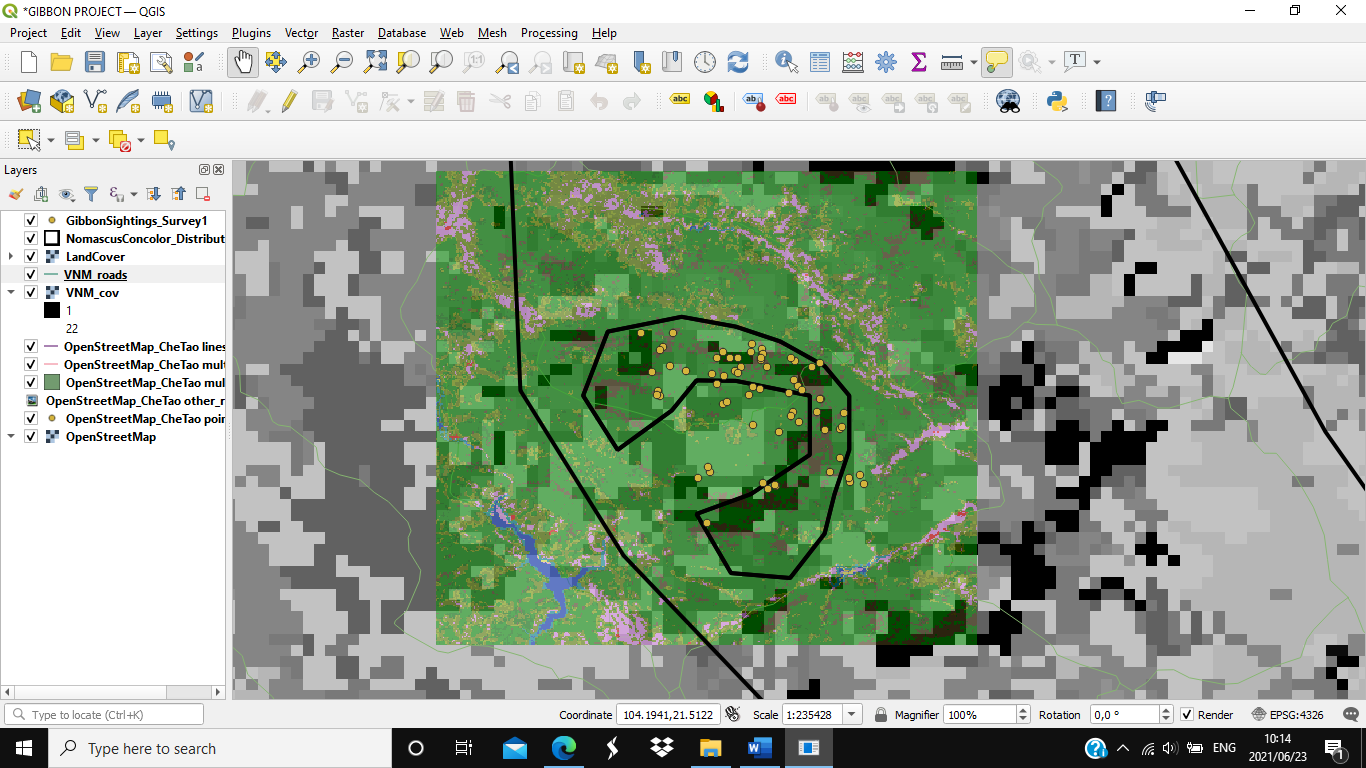
By learning this module, I am able to understand the differences between vector and raster data plus, the quiz was very helpful gave a better understanding. Coming to the assignment It took some time completing it but it is all part and parcel of learning. Well, it took me time to figure out how to make the background transparent and making the layers into subgroup. Plus, I had some problem in dragging and putting the .vrt file into map but I have to mention my friend @Victor for helping me out. However, this module has helped me to learn how to represent data well and make comparisons between them.
Thank you and please share your thoughts about my work