I think this has been a more challenging assignment compared to the first two. Determining which SRS to use also requires some reading up. For this assignment, we were guided all the way. But I believe I will need to be more prepared when I attempt working on my own data in future.
Thank you, Lucy! I am enjoying this workshop immensely
This module was really insightful as I learnt about the different datum, SRS etc. I always thought that it was a one size fits all type of measurement, alas, I was wrong. This module also helped me move more towards my learning goal as I learnt how to transfer field data into QGIS using CSV files and how to make sense of them in QGIS.
It’s been a wonderful module and I can’t believe next week is the last!
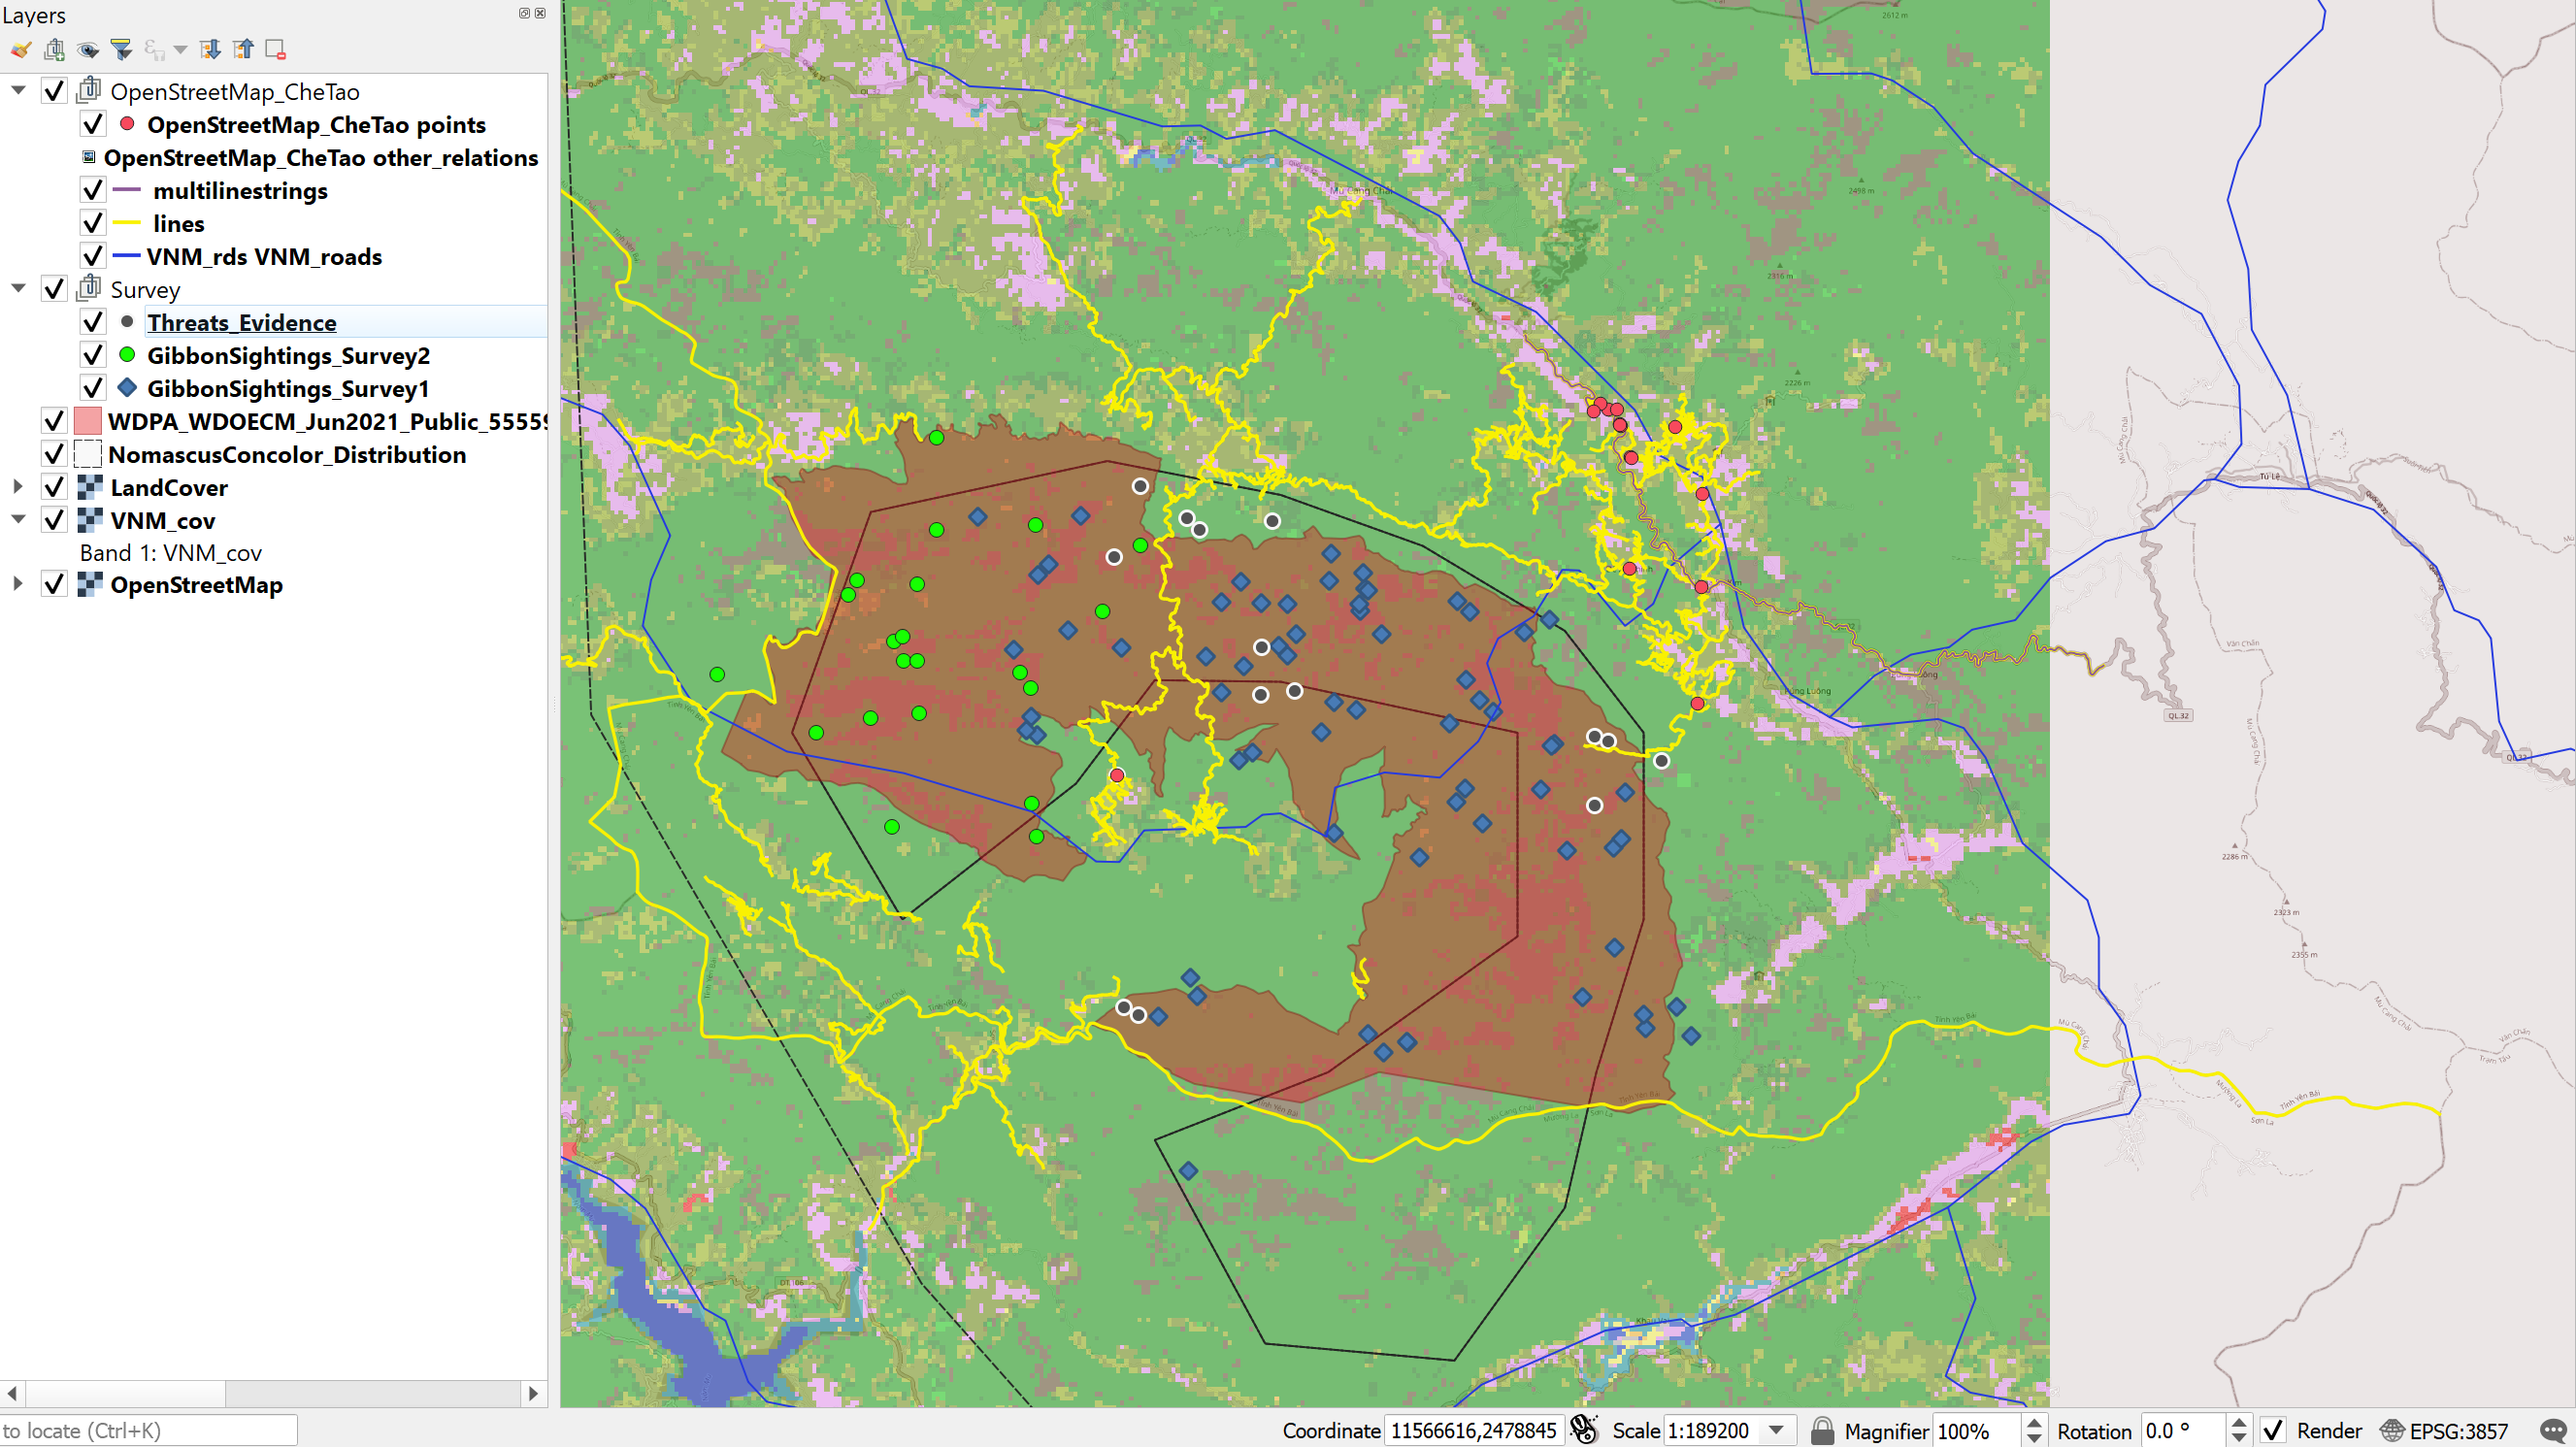
I really love how you manipulated the originally green layer (landcover) to appear as it is! It is really cool and original. Yes, I agree that when we deal with our own field data, we will have to be more thoughtful of our steps and what SRS formats etc to use.
That’s a good idea- to use a yellow background. I agree with the one setup doesn’t work for all situations. Looking forward to the next weeks assignment
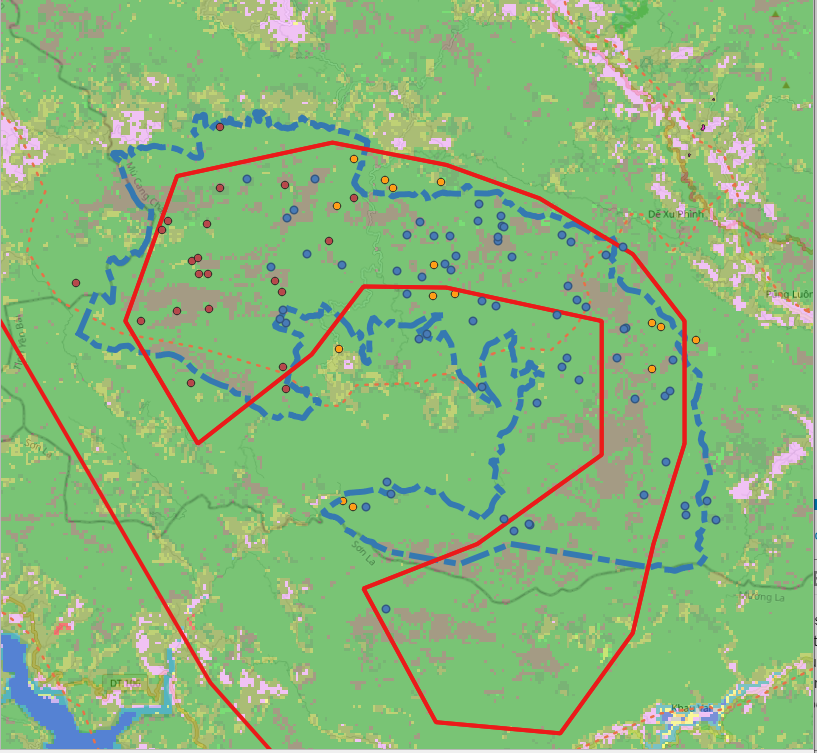
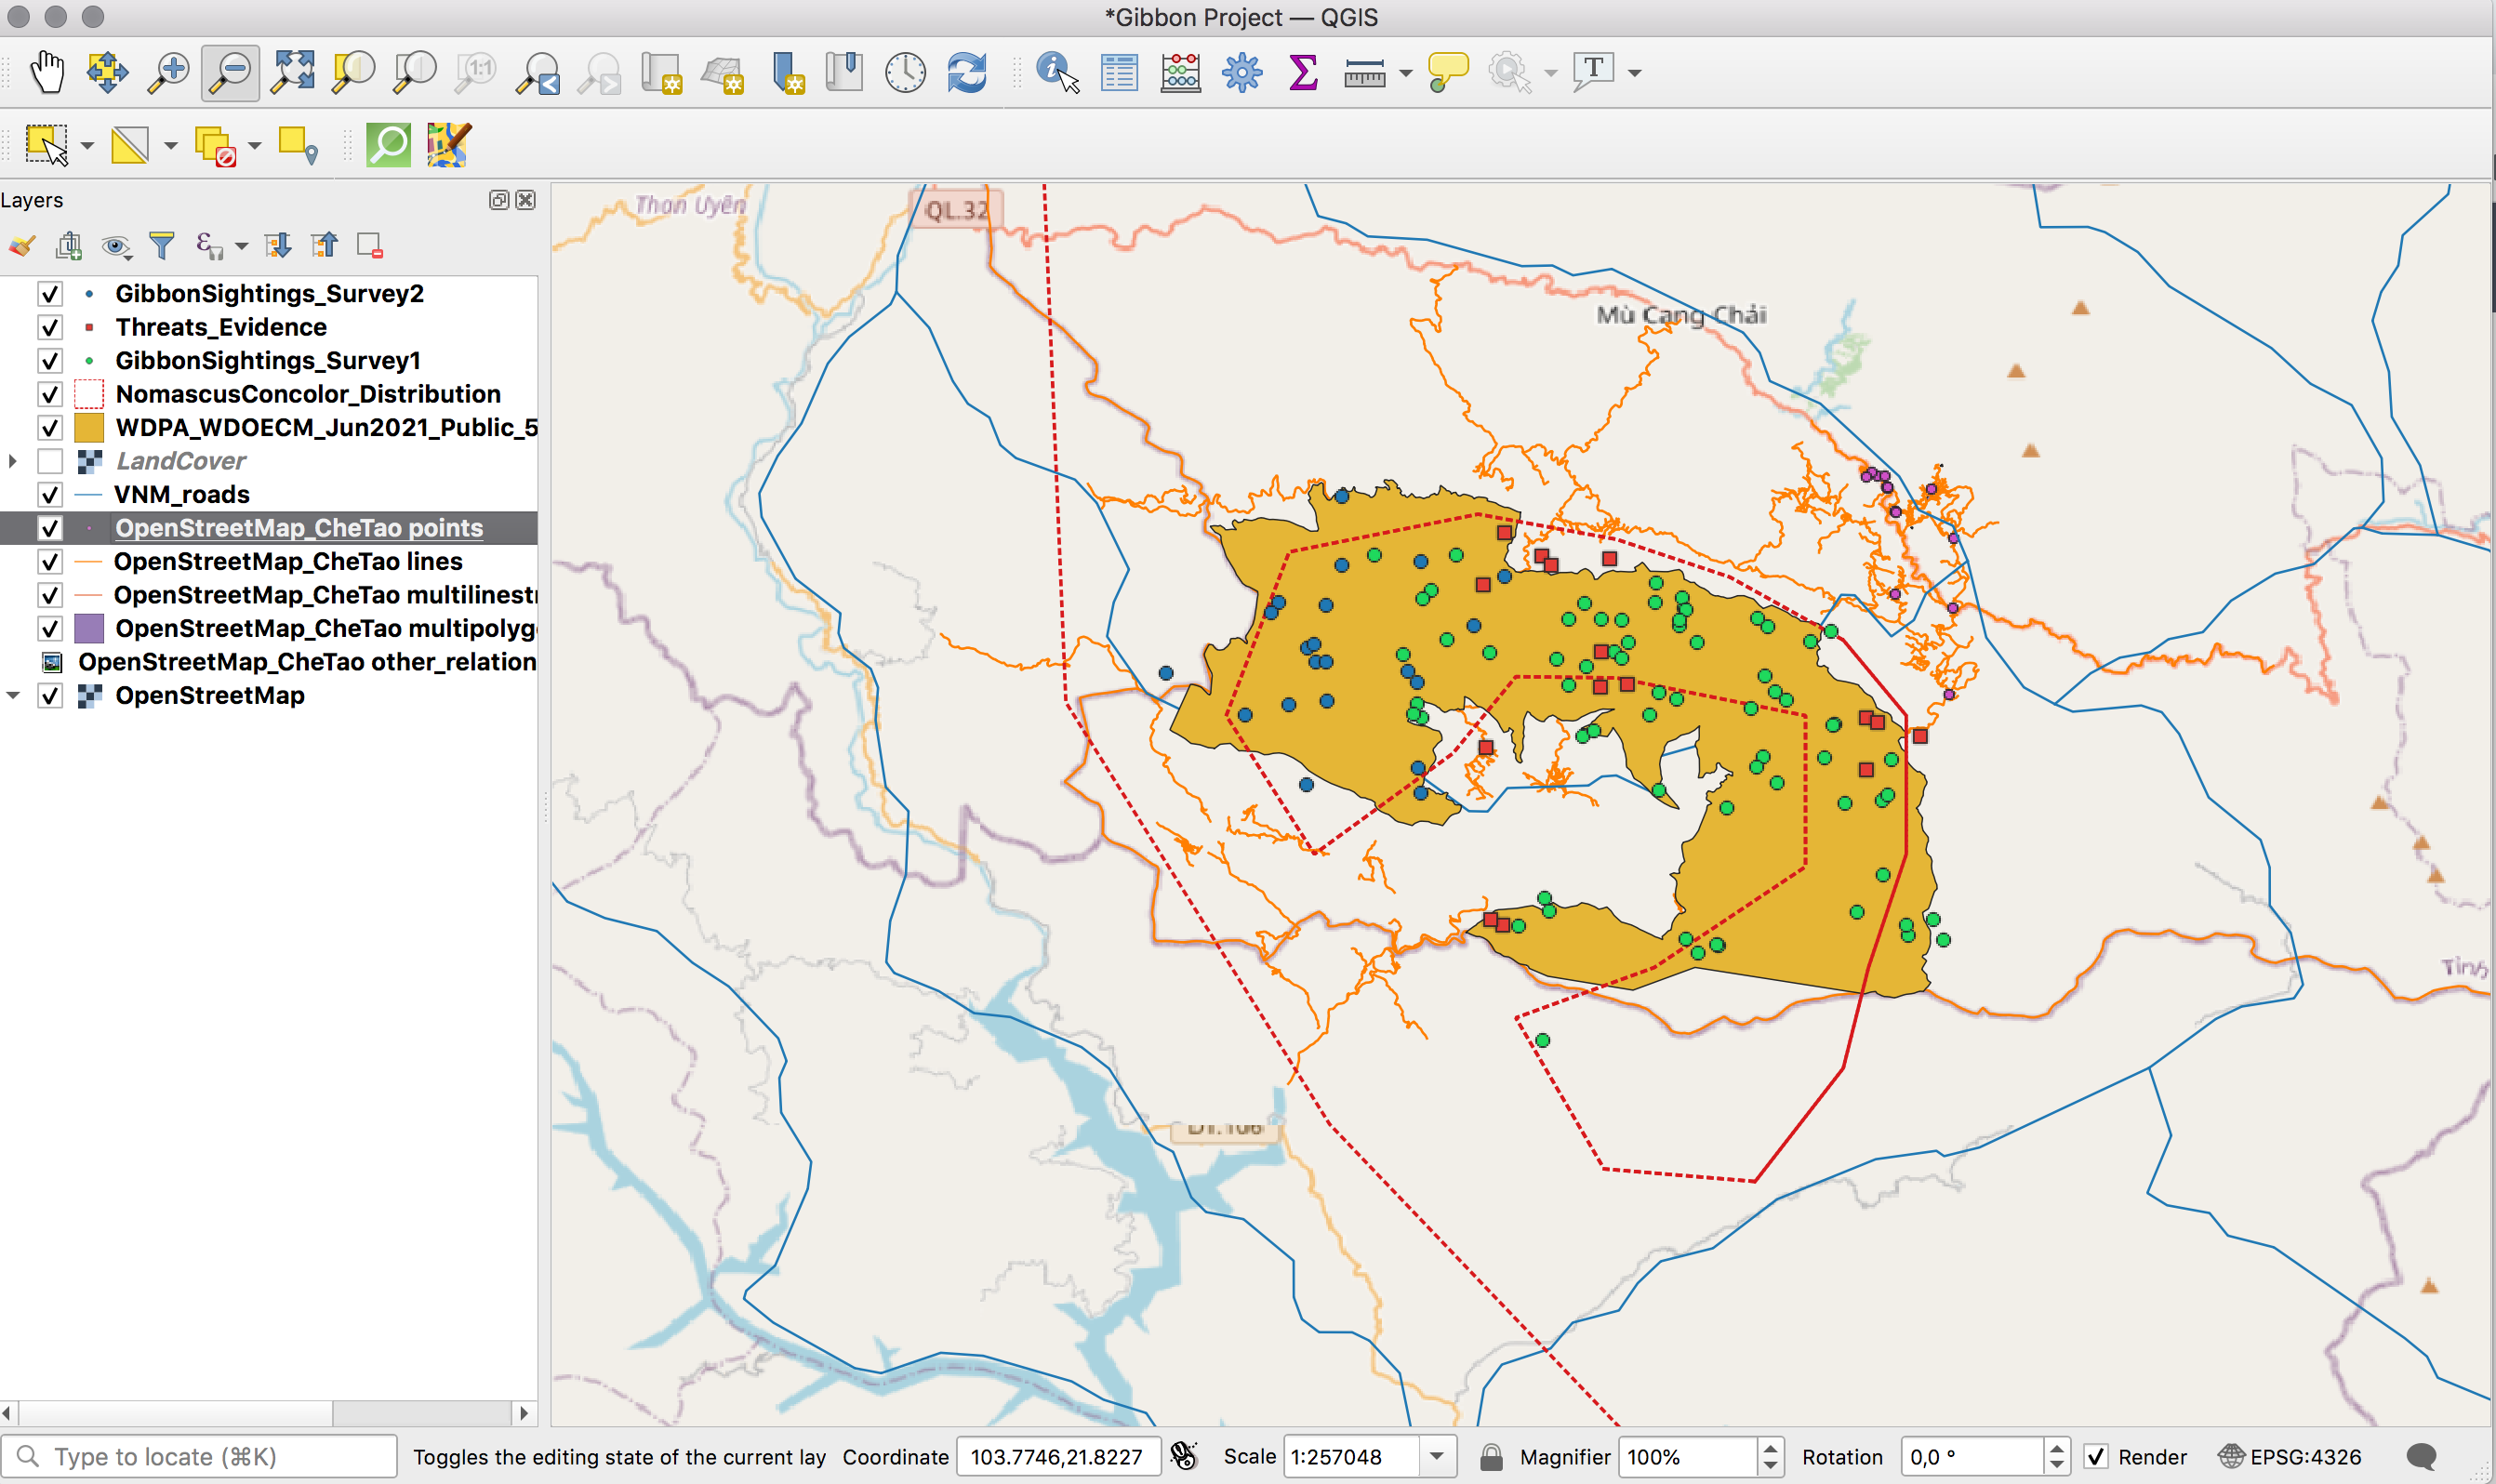
I enjoyed this task and thanks for he updated instructions, as you can see I managed to work it out the conservation boundary ahaha. I’ve toned down my map a little, made the points smaller etc. I was wondering could the points be made to hotspots? like the more points the larger the hotspot (in other words proportionate)?
Definitely got my head around some of the terminology. The SRS and CRS working out angles etc that went over my head slightly. will take some time to work out a cone view, cylinder view and what not ahahah
Here’s mine for this week.
An interesting one taking a bit more thought that previous modules. I thought it was really interesting that you can assign the SRS as you’re importing a layer and that this can be different to other layers I just always assumed you’d have to convert them in advance but it’s great that you can do this as you import
This module has really boosted my confidence to a higher level to work with GIS, because the kind of important basics like (CRS/SRS, choosing and selecting appropriate CRS and identifying the CRS type of our own data) which is very crucial and tricky. Before this though i have gone through many text or classes of GIS during my masters as well as while working as a wildlife professional these days but i haven’t understood these concepts before, its through this module only i have get my doubts cleared and answered to work with crude .csv file and importing such files in GIS software.
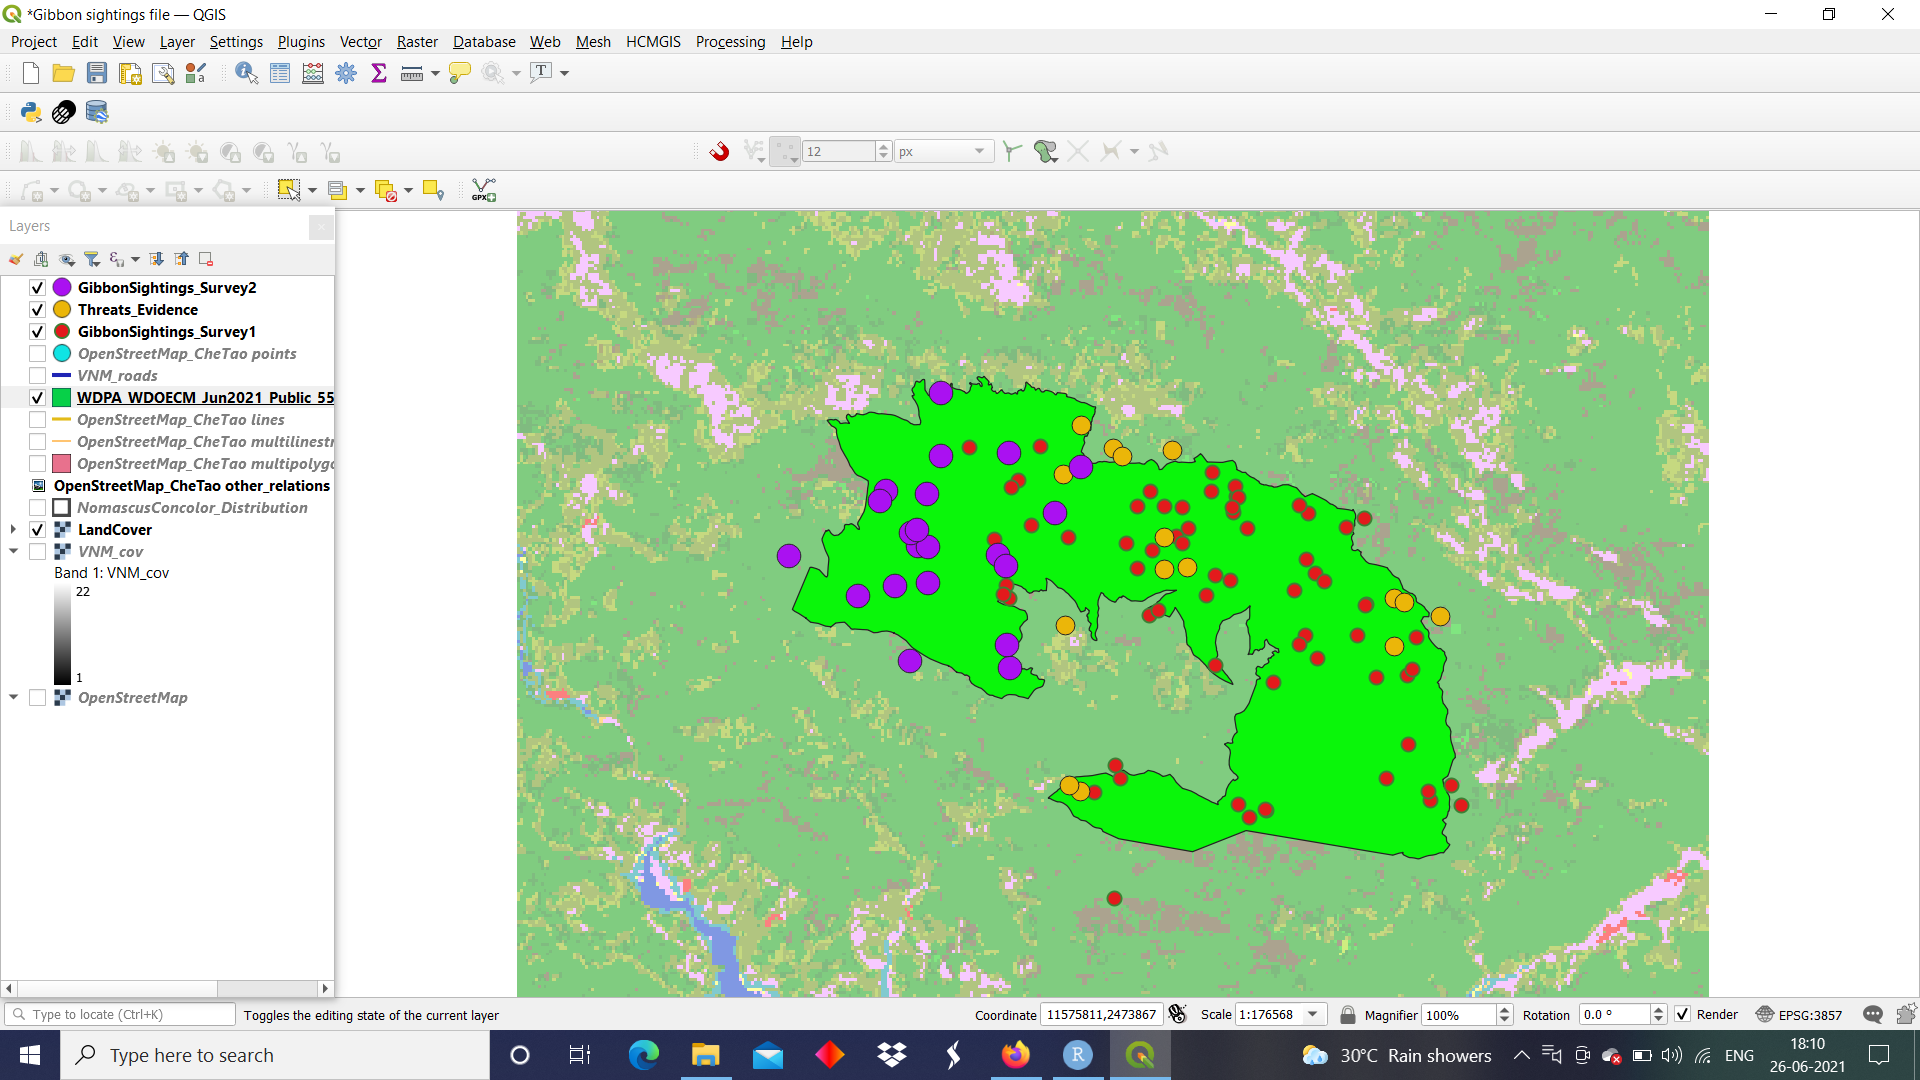
Wow, nice background Land cover colour! May I suggest to either change the symbols or colours for the two different surveys of Gibbons so that both data set can be differentiated better? Great work!
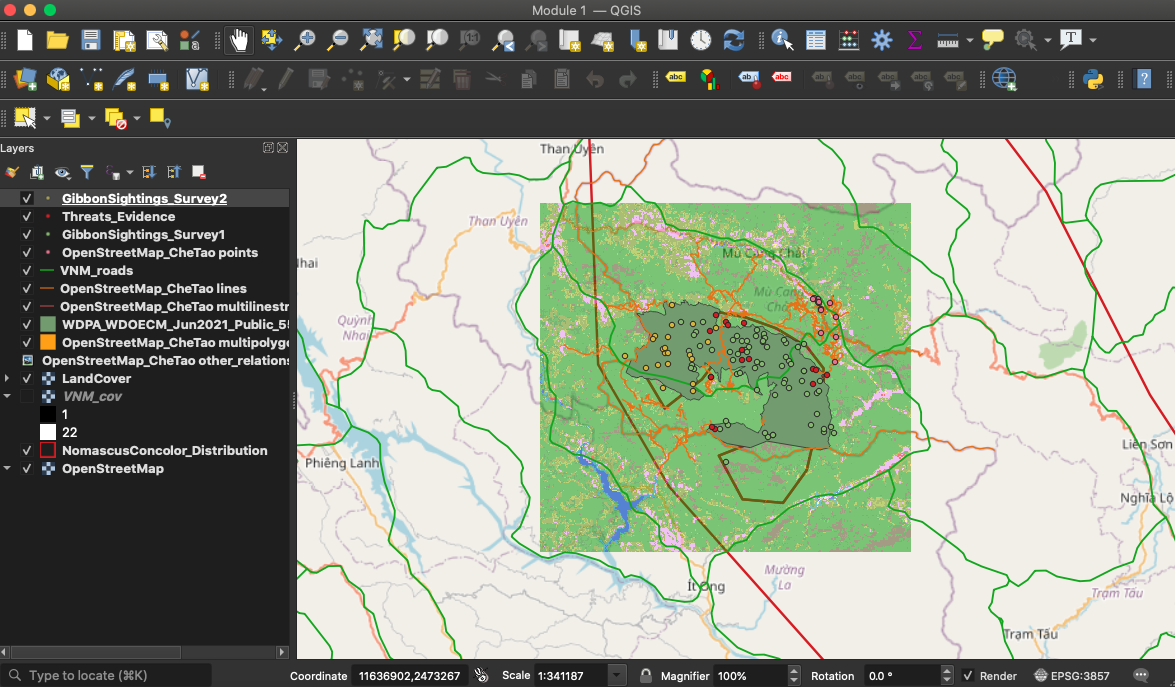
Besides learning how to import csv file and the different SRS, I tried tweaking the colours around and use different symbols to give a better graphical overview. Still struggling to determine which colour contrast to use but here my assignment this week. Another new thing I have learnt is that I can combine symbols which I used to represent threats. Productive week!
As I am in the UK I have been using WGS84 as a standard but it is interesting to learn about different SRS options and what might be best for different projects.
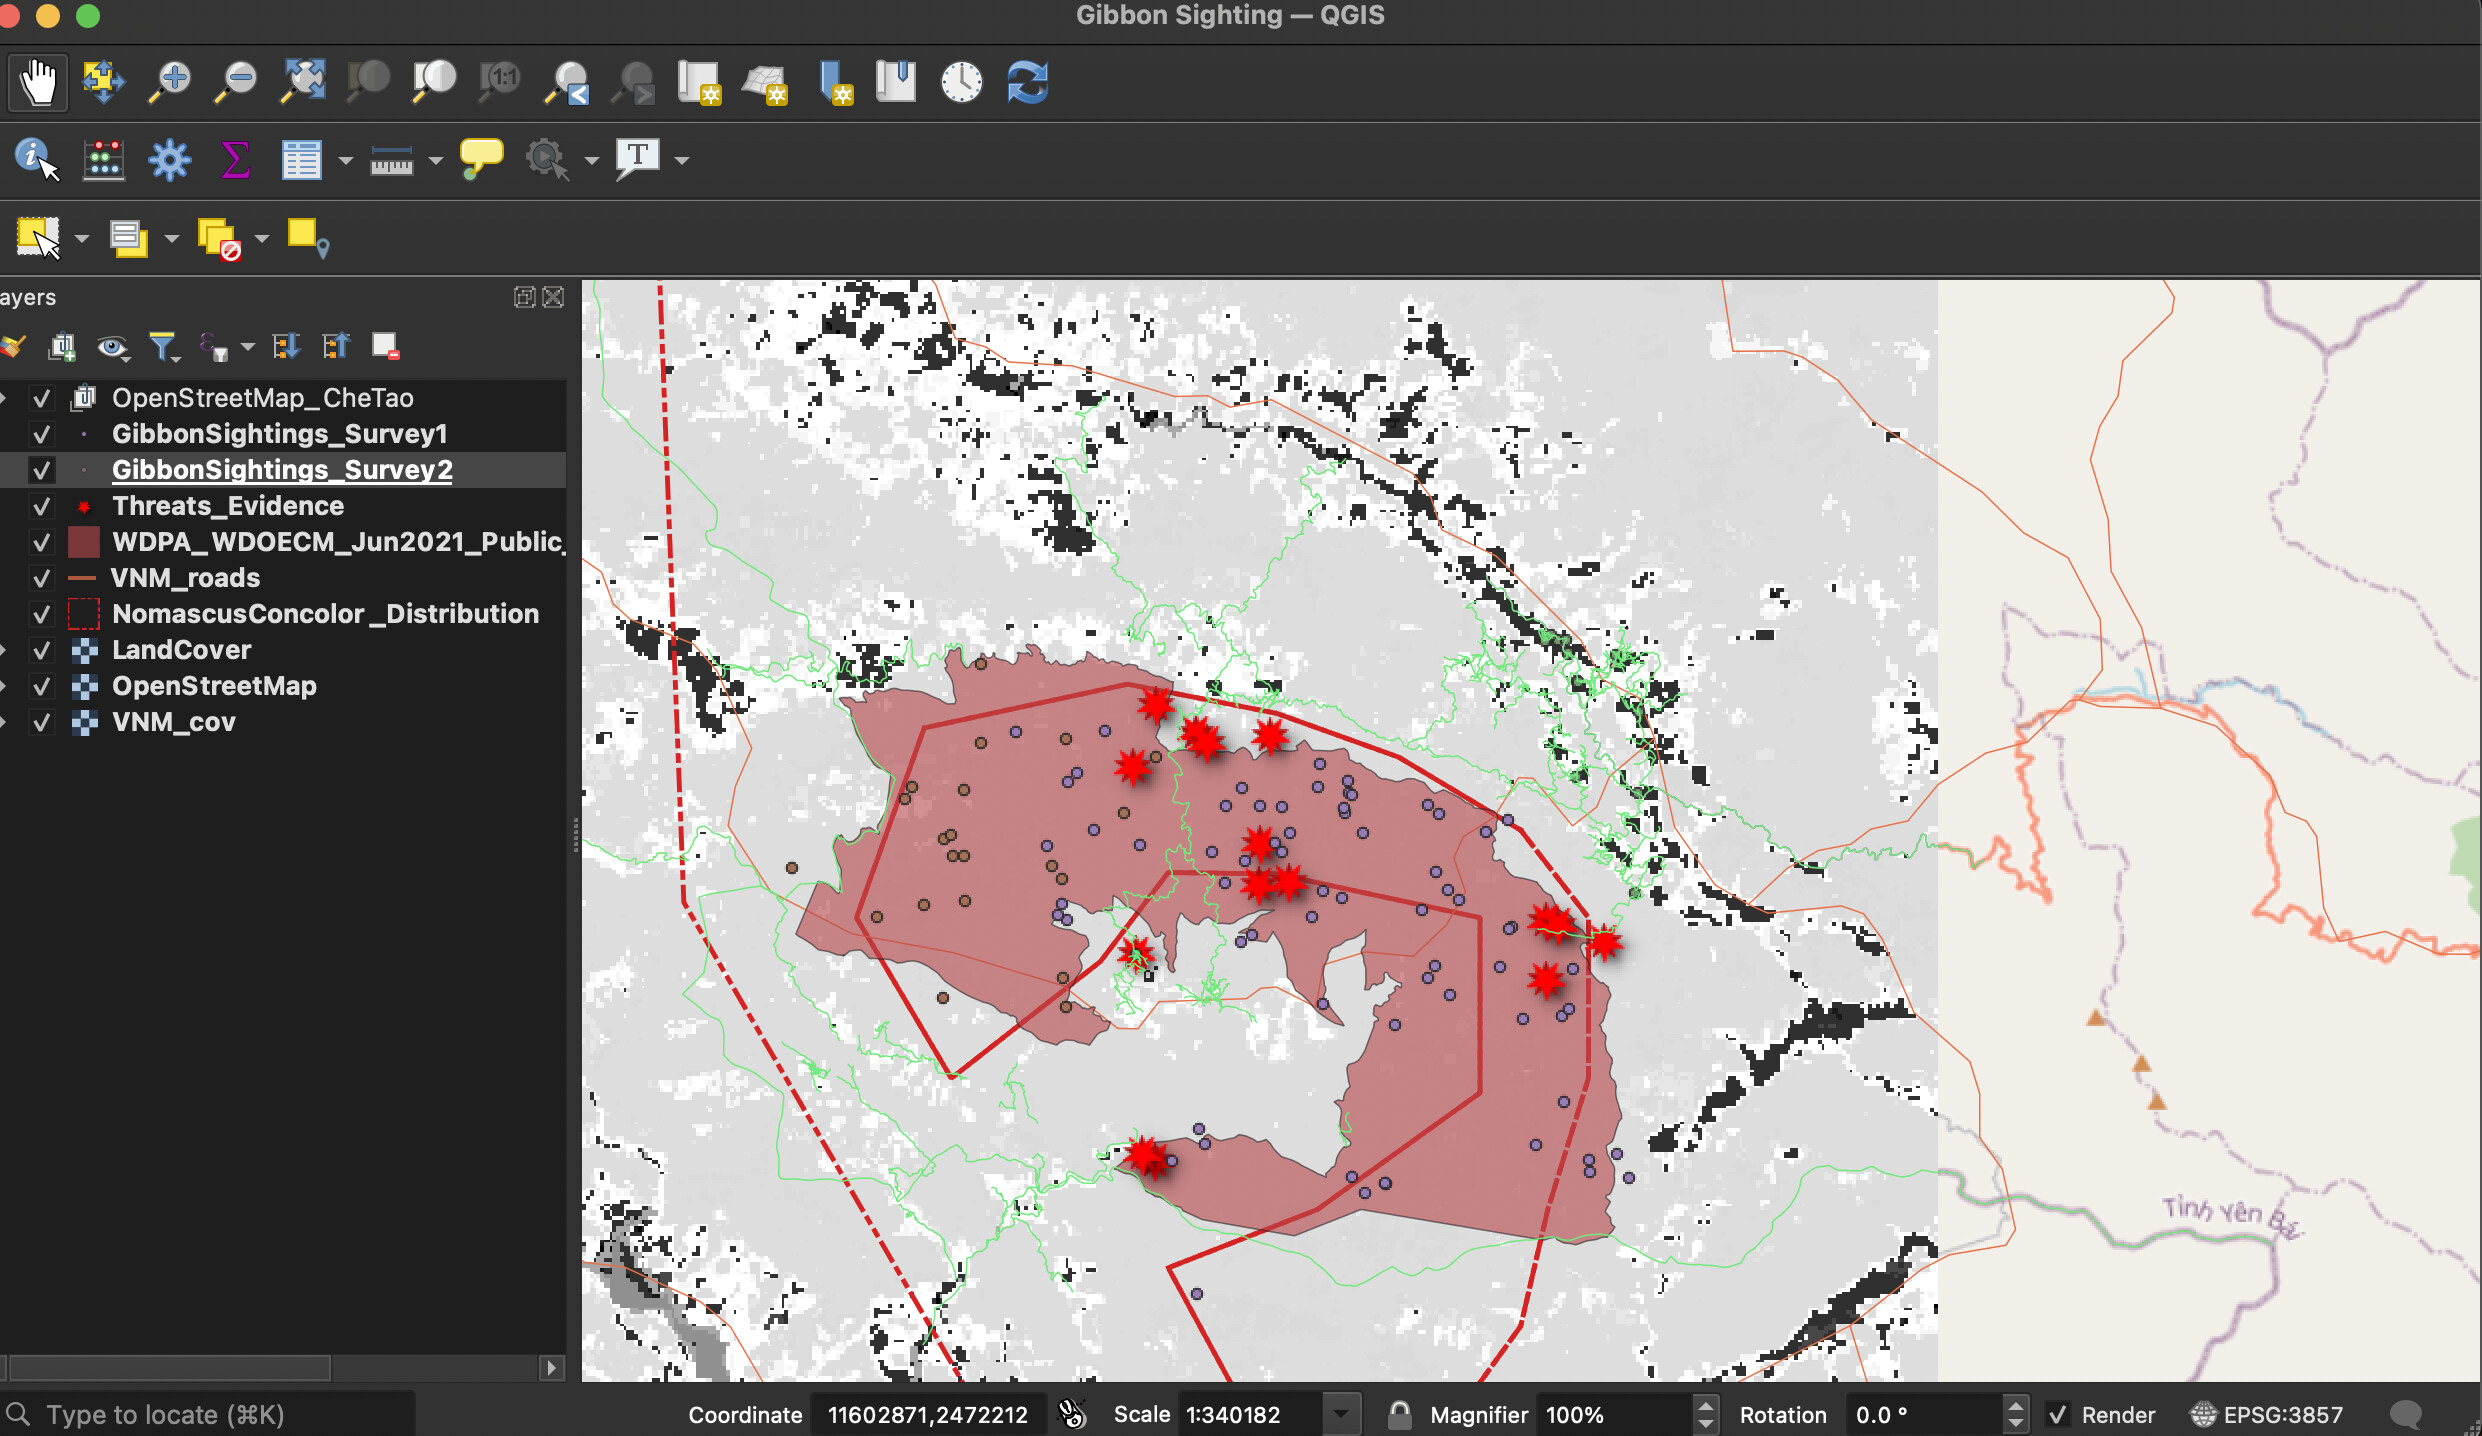
I feel comfortable with the concept of text-based data files and can see applications for much of the field work I am contemplating. To be honest I still have some difficulty with applying the concept of SRS choice, and don’t yet feel confident about my capacity to sort the differences or make appropriate selections. The module did increase my understanding of where next phases of learning should be directed. In my representation, I attempt to show all data sets in the context of what I think is the Che Tao Nature reserve boundary and surrounding navigation references and waterways
Hi gautam_wildlife, I like that you are being selective about what to focus on (there is enough here that it is too much to show all at once). Your presentation has prompted me to see if there are ways to annotate the landcover data. Best regards!
Thanks apuuli, i can see that you have really make a nice and clear illustration for all the relevant data layers as per the need and the information from this module.
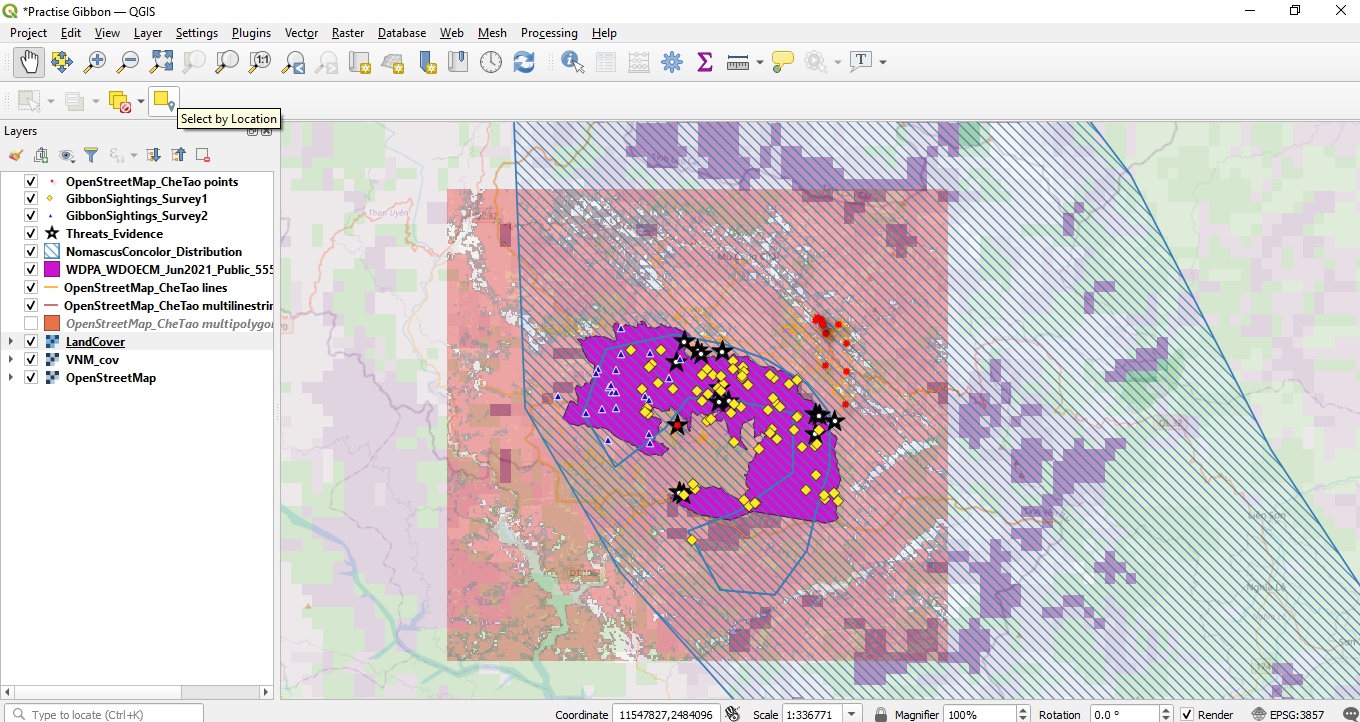
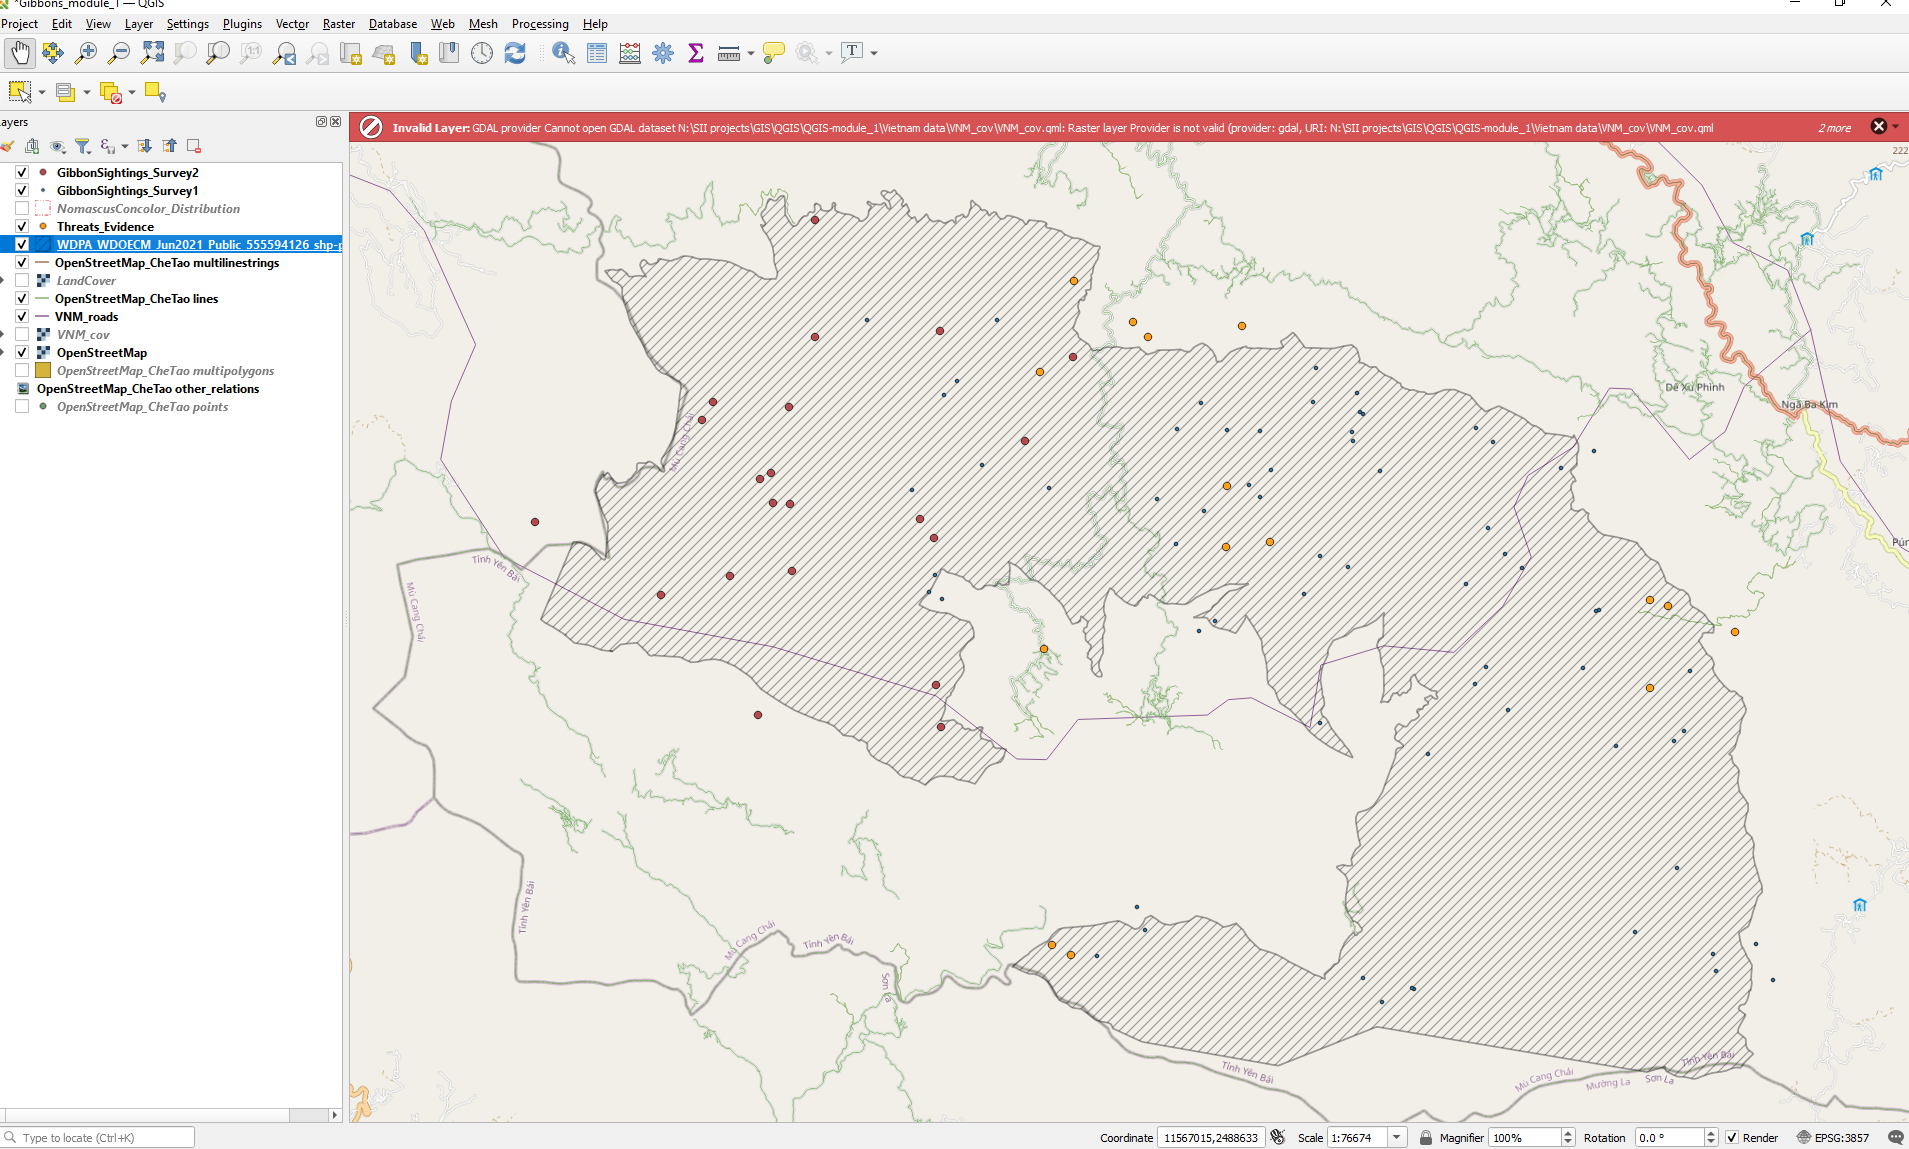
In this module is really crucial to know and understand the differences and which SRS to use, which requires some reading for personal knowledge as well as for the public to understand its graphs as well and best which to apply for different projects. In this assignment, I didn’t change the land cover colors to show where the threats happened (Threats_Evidence).
This module was helpful for me as it showed me how data captured in the field can be translated into useable data on a map which was one of my main goals for this course. I see now that you can use GPS locations as well as points of interest in a excel sheet, add it as a delimitated test layer and it translates to your map. I will use this in future when wanting to translate my data onto a map. I also found it very helpful to know now how to input different SRS systems and to change the settings for them accordingly. Compared to last week I have learnt to right click a layer and zoom to that every time I zoom too far out or move away from where I need to be, this works a lot better than using the zoom in or out tool. This module I also decided to remove the low resolution land cover map for now as I don’t believe this layer is relevant just yet and would hope to find a higher resolution land cover map. I would also like to incorporate the threats into the landcover map but I don’t think the map allows for that? Or Im just struggling to utilise the landcover map,Im wondering how to extract the landcover specific data to show its relevance to the threats for instance? I would also like to create different vector point symbols for the different threats.