Hi Victor, good insight for the SRS system understanding. I agree I think I need to follow up on the difference and applicability of the different systems. I would also like to incorporate the threats into the landcover map but I dont think the map allows for that? Or Im just struggling to utilise the landcover map, do you know how to extract the landcover specific data to show its relevance to the threats for instance? I would also like to create different vector point symbols for the different threats.
1 Like
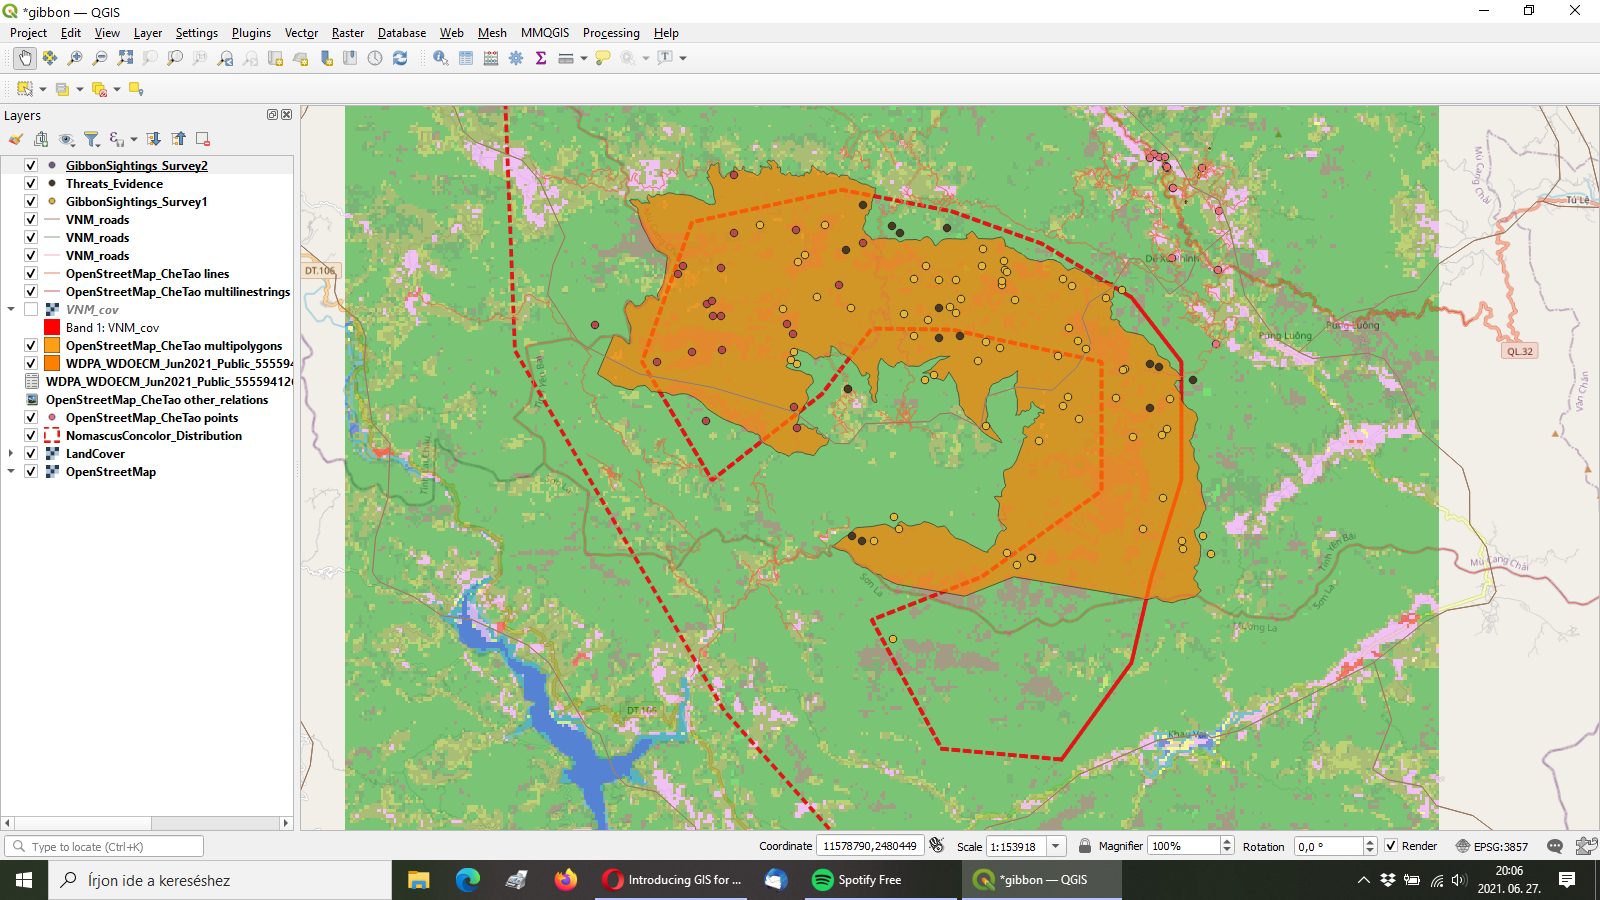
I like the different symbols used for the different sets of data, it makes it really easy to differentiate!
As a complete beginner, I did not know about the different SRSs, so that section of this week’s lesson was a little challenging. Learning how to import csv files to visualise them in QGIS will be useful for future work. I also learned from others’ assignments and changed the symbol shape for threats to make the points more readable.
1 Like
This module was not as practically challenging as those before it; however, it required quite a bit more reading. I had no idea about the number of CRS types out there. It has made me think twice about the type of data I record in the field myself and which might be appropriate to use at a local scale.
If anyone has suggestions regarding which CRS I should use when mapping the distribution of seagrass meadows in individuals estuaries in South Africa, I would greatly appreciate the advice.
This module has helped me make progress towards my goal by pointing out important facts I would need to know beforehand when collecting data in the field.
2 Likes
I really like the way you changed the colours and symbols. I’m a complete beginner and am also enjoying playing around with the different settings.
Perhaps consider using bland/light colours for the underlying maps and brighter colours for your symbols if you wish to emphasize the sightings.
I am going to try and change the symbols in my next assignment too!
In this lesson I learned about the different SRS. It is a little intimidating how many there are, while it introduces an extra layer what I have to monitore during work.
1 Like
Hi apuuli,
You have made a very nice and professional map!
As someone new to GIS, I was not aware that there are many different kinds of SRS that can be used to represent geospatial data. I am glad that I now know about this, and I will read up more on my own about different SRS.
1 Like
I like how you made the points different colors in order to better compare them. I also agree that it is a bit intimidating to see so many different SRS!
In the middle of module 2 while I was downloading & adding those encoded data to my QGIS project, I was wondering how my field datasets will be ready and in what format for the QGIS. But now, I think, I get a clue as to how QGIS deals with the field data collected using different SRS types/ Lat-Long, projected/ and how a field data is added to QGIS project.
Moreover, this module 3 comes with more details. The steps with visual instruction ( screenshots for example) are helpful for new beginners.
1 Like
This was my favorite module so far. It was really helpful and gave me a lot to think about regarding coordinate systems! I will have some research to do before next week. No problems this week - just homework!
2 Likes
I love your specific feedback and also your map colors! We all have different ideas about layering the map, and I like you stacked your layers.
This week’s lesson was very helpful in clarifying what I need to know when integrating different datasets since different layers may use different: (1) Coordinates - lat /long or a projected coordinate system, (2) Map Projections, and different (3) Datums.
I primarily work with lat/long coordinates from a hand held GPS, but would like to integrate these data with remotely sensed seagrass and mangrove coverage data, I now know I need to check with my collaborators as to what SRS they used to integrate the different layers, do some spatial analysis and make a nice map of the results.
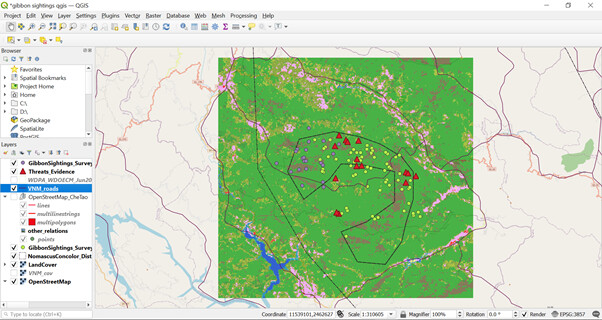
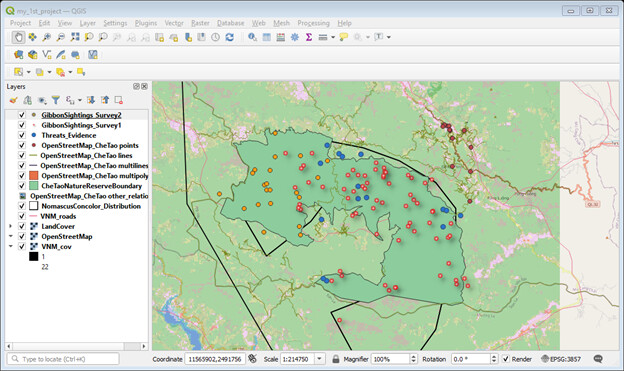
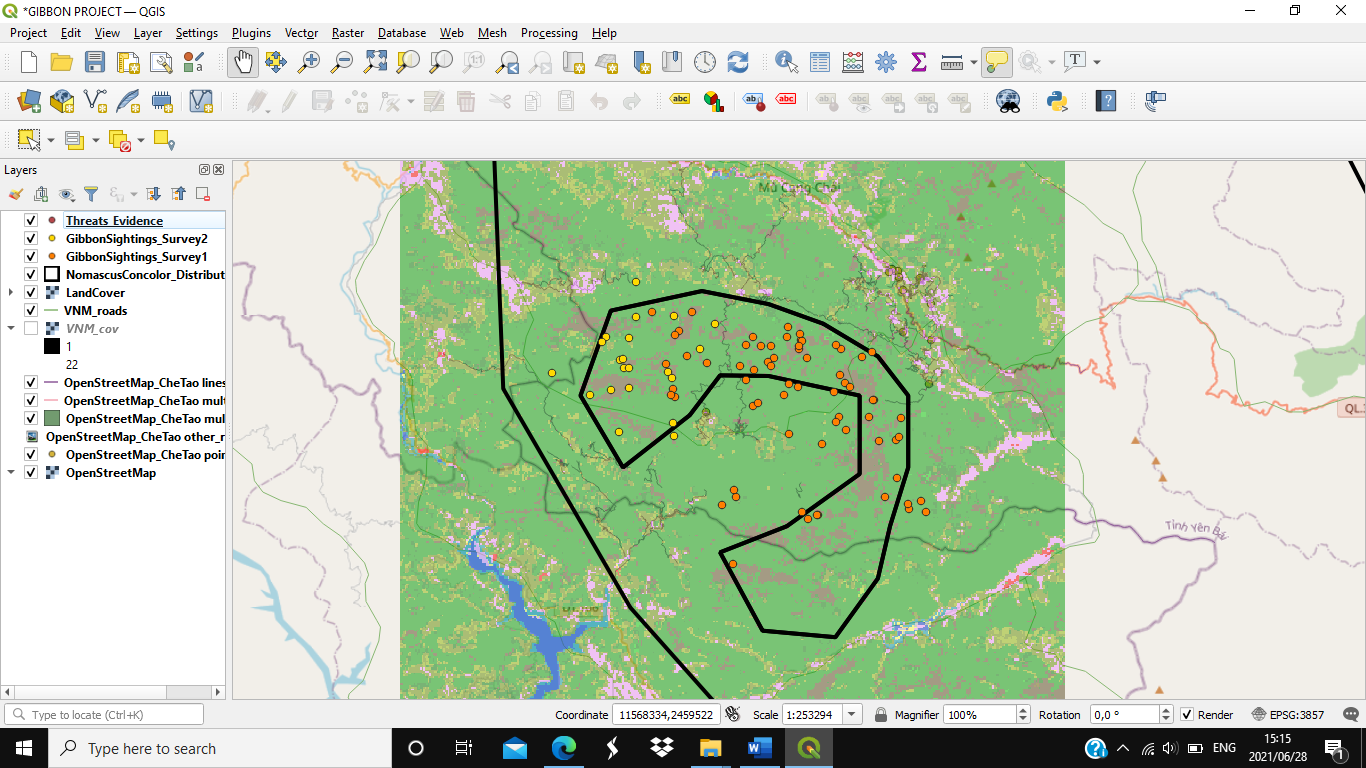
Data Lucy shared with us was very useful to show sightings from 1 survey, combined with another survey (taken in a different way), plus the threats layers.
1 Like
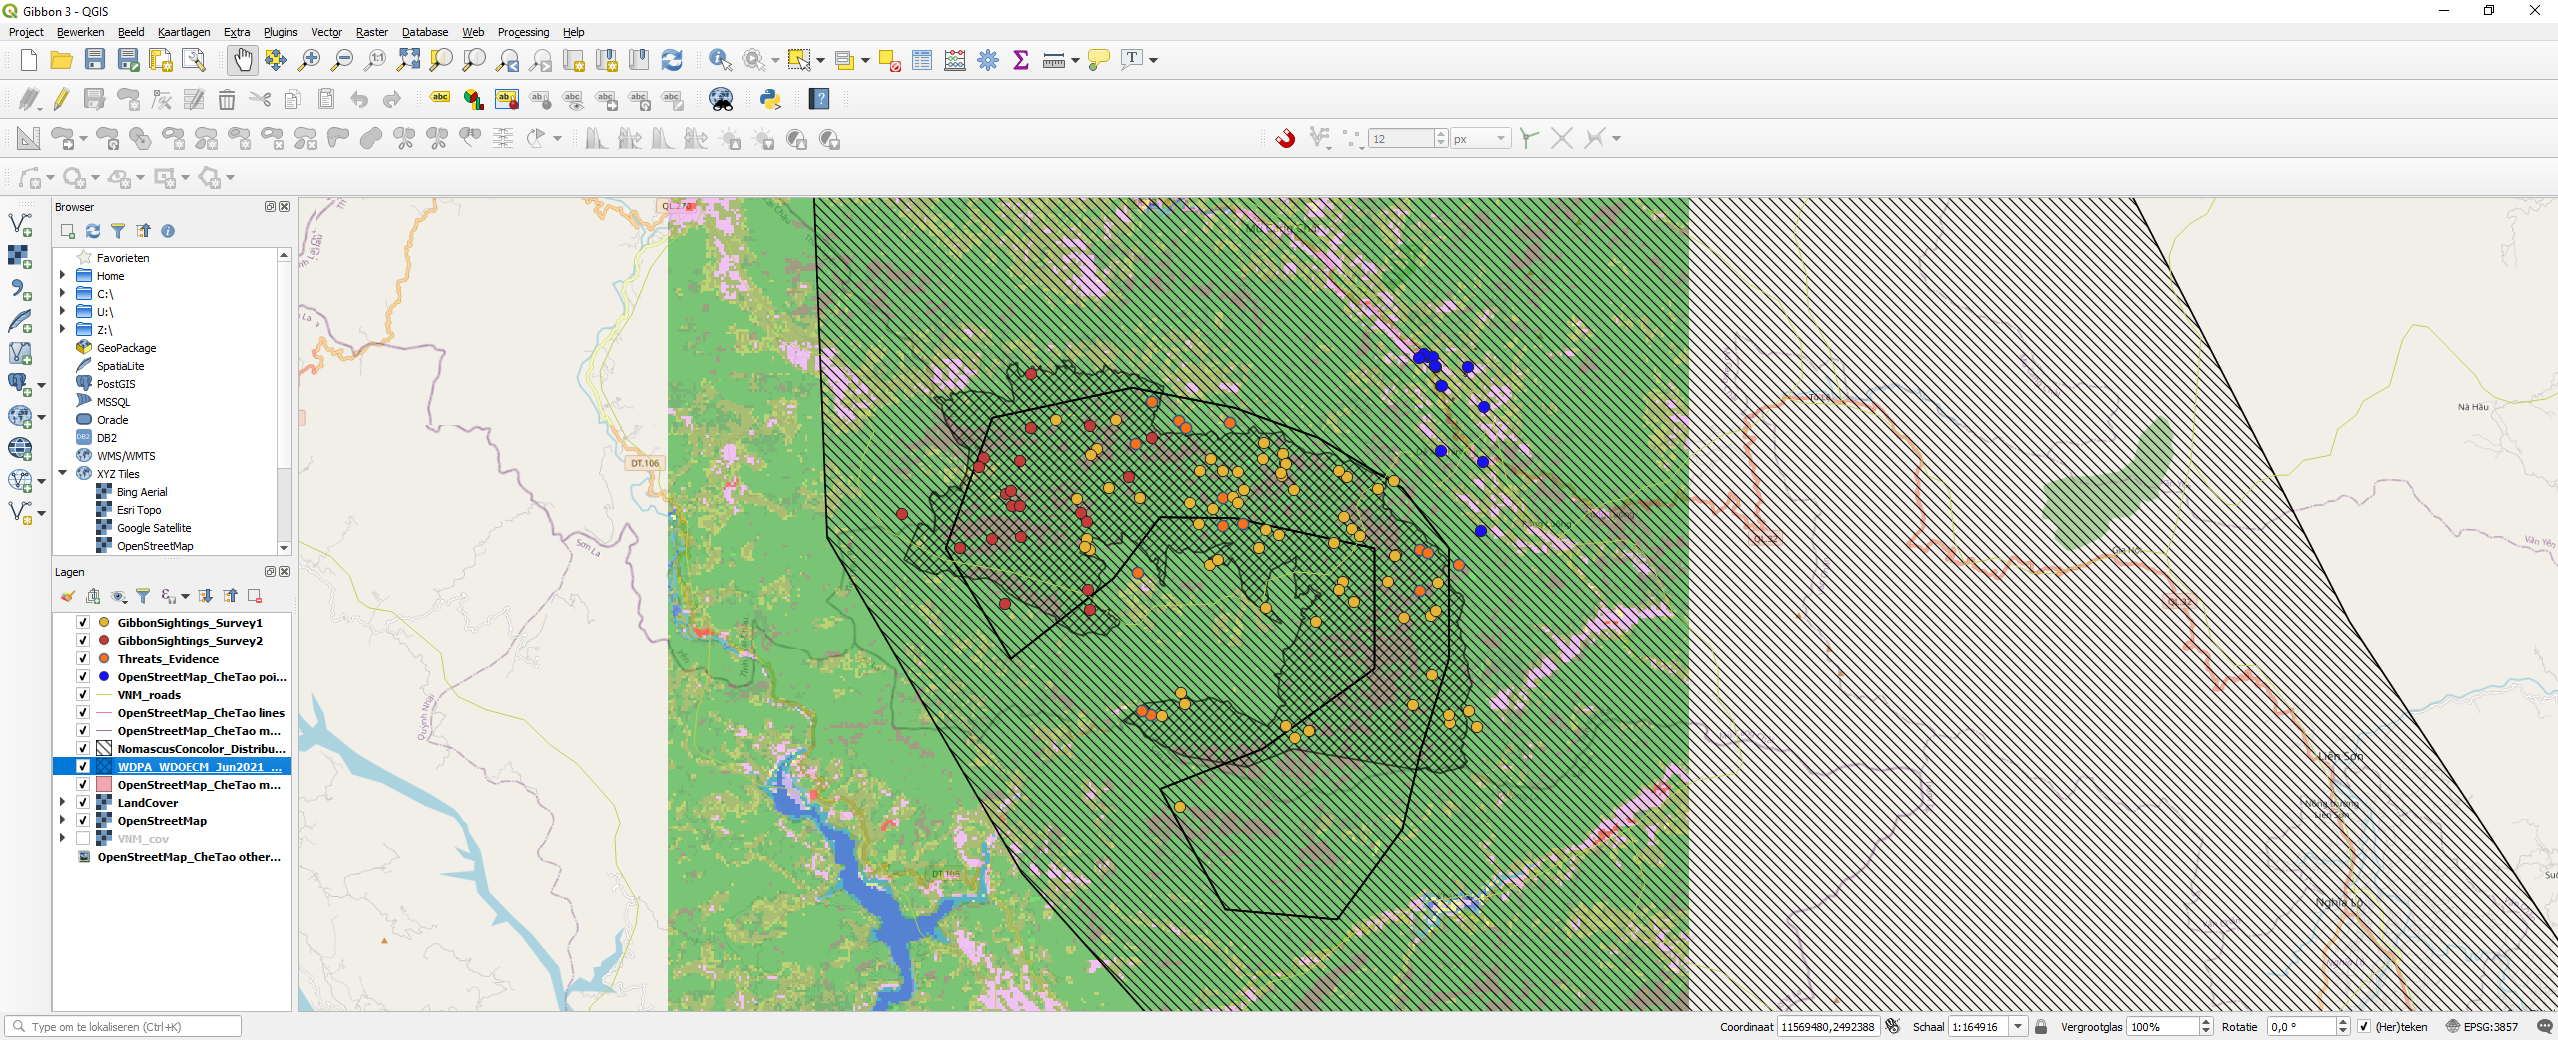
I like how you placed the Reserve Boundaries (finer scale data) on top of the more coarse data of Gibbin Distribution. Using different colors for threats versus sighitngs was also good, but the two different sighting datasets have very similar colors so it might be nice to differentiate them a little.
Does the site you work in have good raster or vector data layers that you can use, on top of the data you collect yourself in the field?
Apology for not including the previous module layers.
This module is great by introducing and explaining the types of SRS and map projections.
2 Likes
Hi @janew, great map projection that you presented here! I like how you presented your land cover as it is interesting and easily understandable. I would like to try it out too with the land cover that you have shown, may I know how to extract the land cover as shown in your assignment?
Looking forward to it!
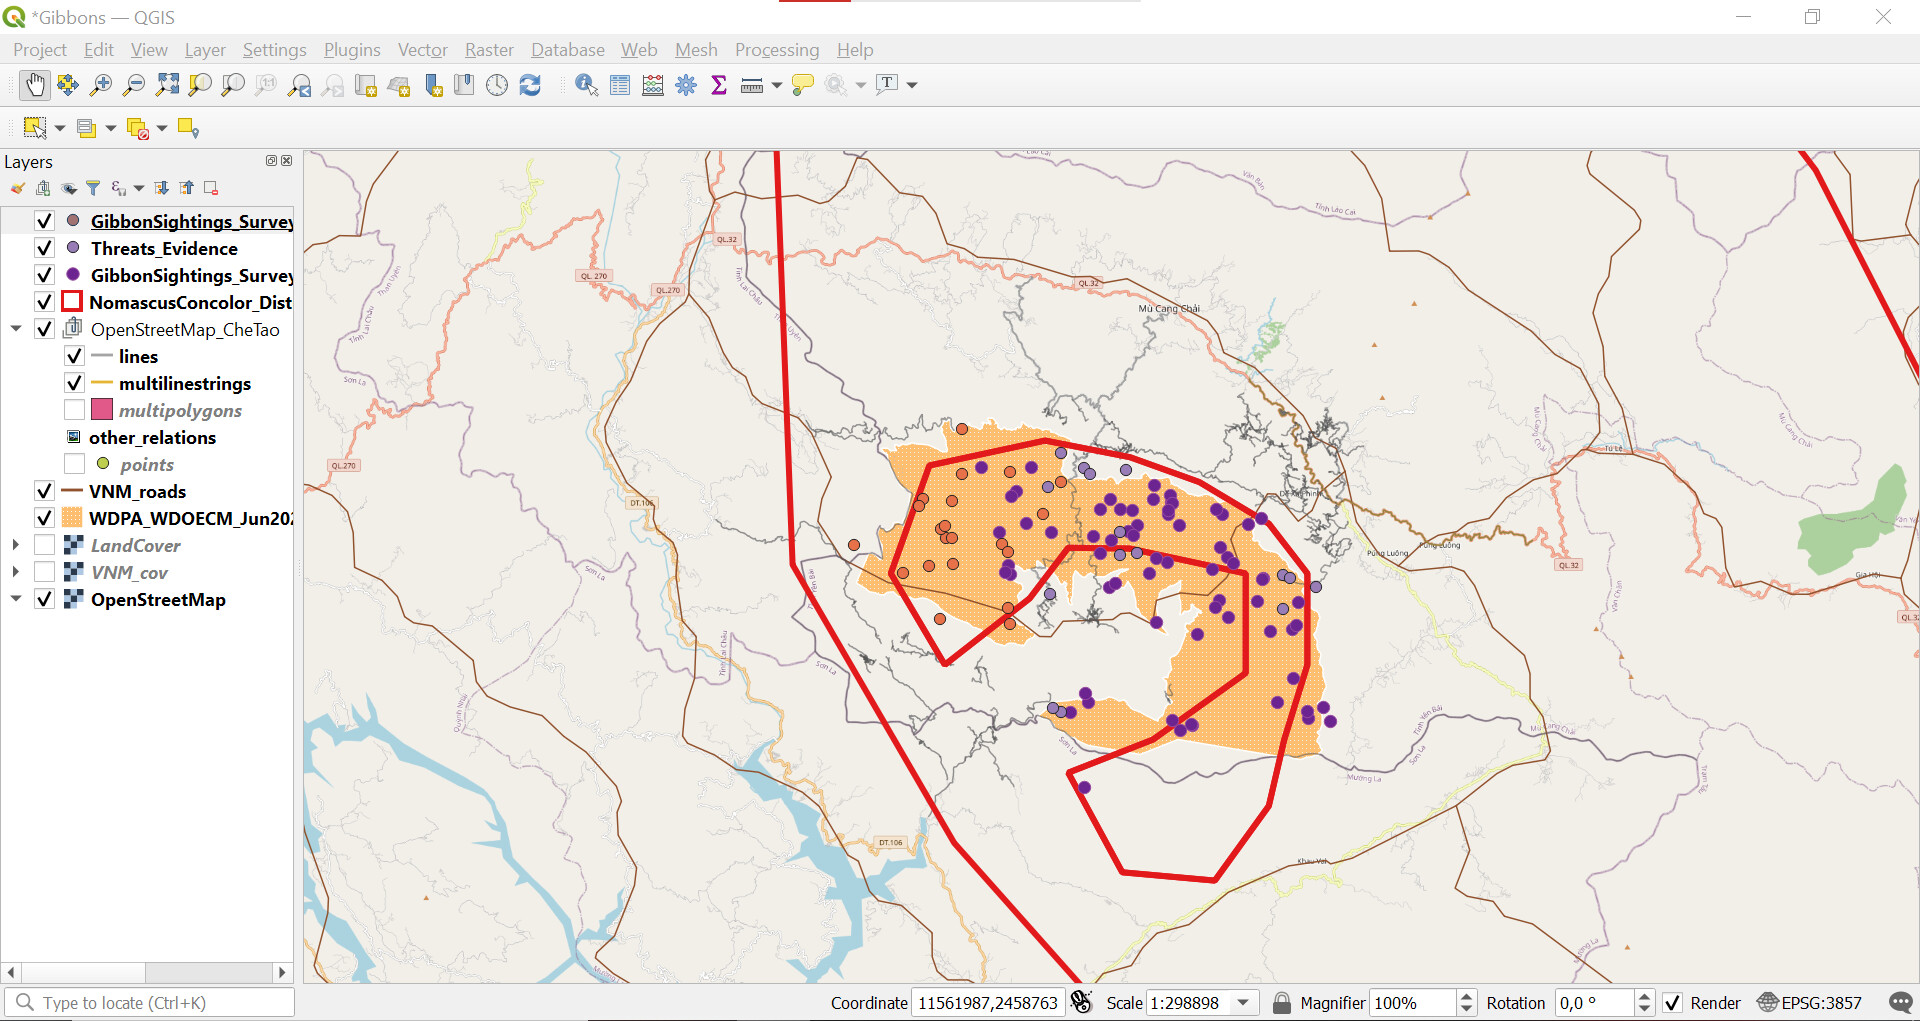
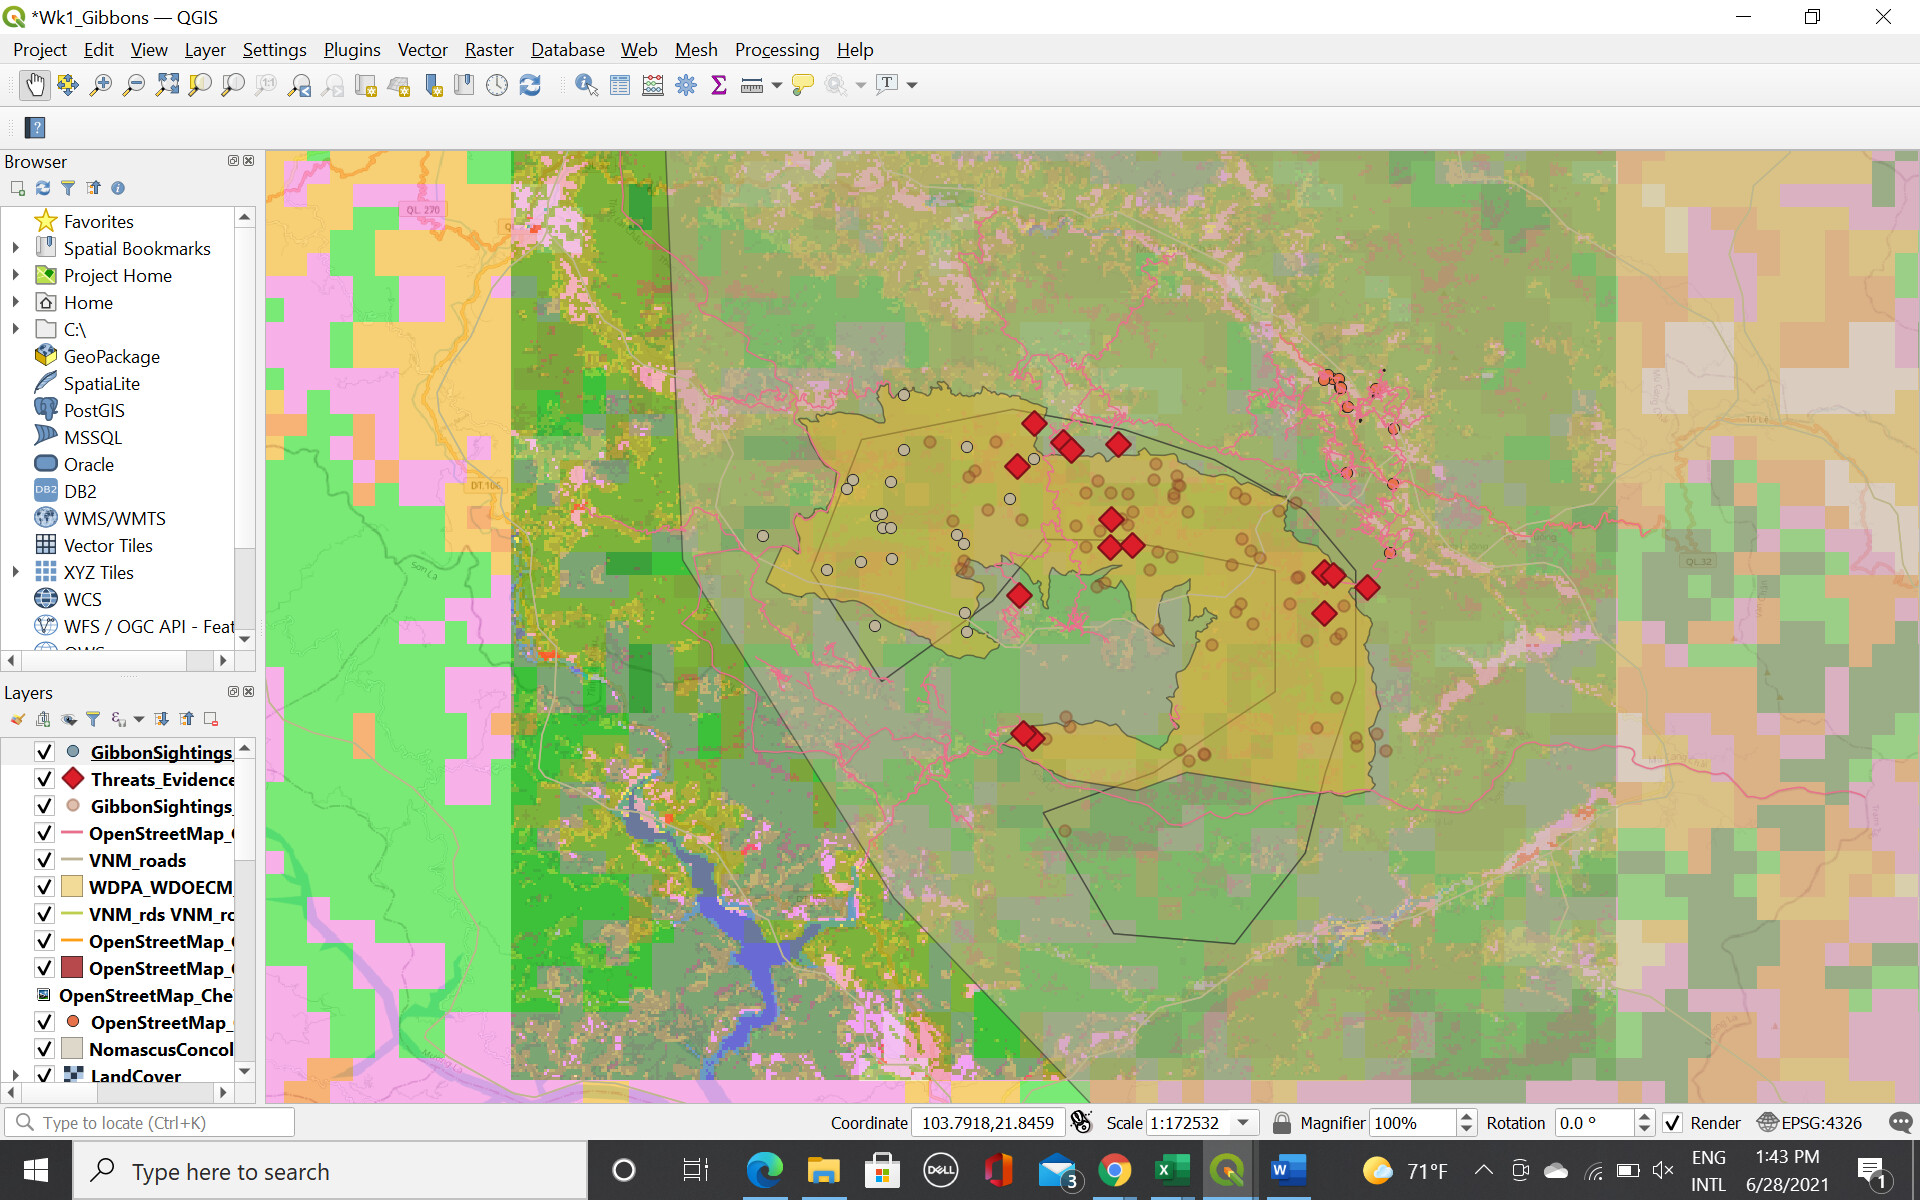
It was again an interesting module for me to get back into information I had forgotten about. I am happy to have learned the different SRS although for my current work I will be using WGS84. When checking my map when I was finished, I was not very happy about the layers and how it was visual. I decided to make the Gibbon sighthing points a bit bigger and change the colors and overlapping landcovers where now everything is visible. The hard part for me is to understand all the GIS vocabulary and use that for the future but hopefully with practice it will come along.
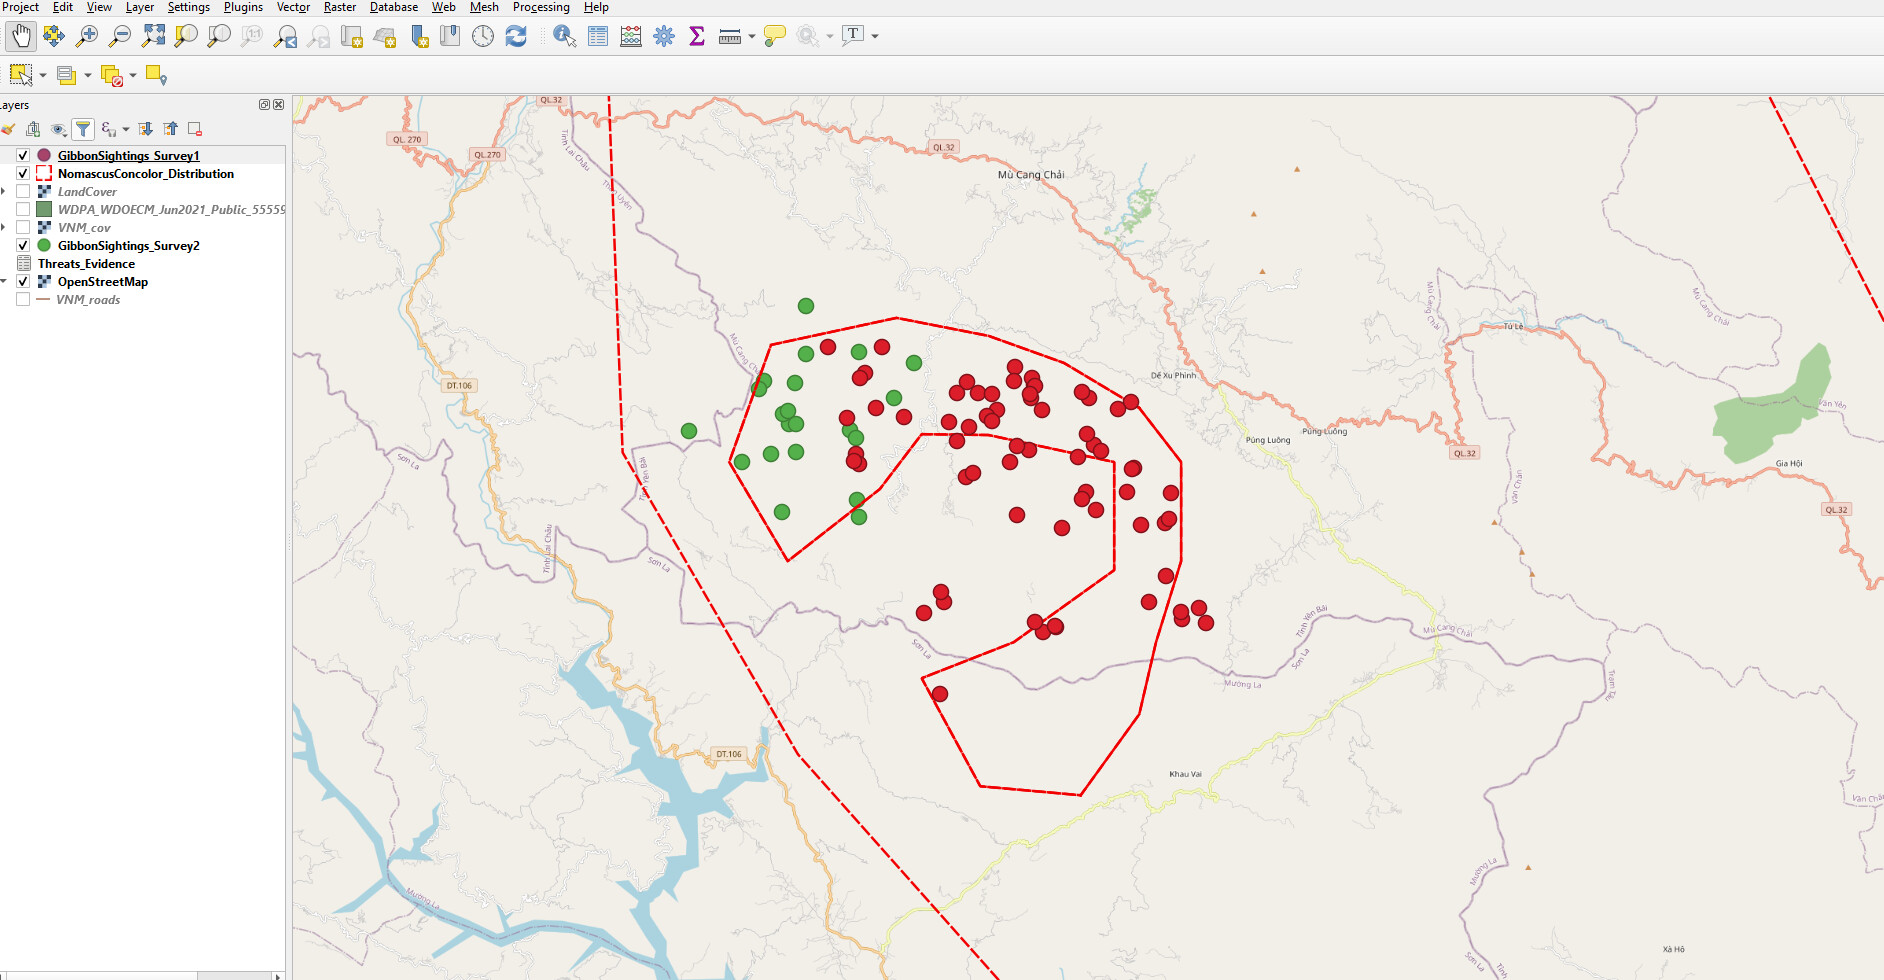
@syn I really like how you have visualized your map with the different symbols and colors. Personally I think the yellow/green dots are maybe a bit small compared to the red triangles. To me it is a nice map with enough needed information and layers to have a good visualisation. Though, I seem to mis the border of the Che Tao Nature Reserve.
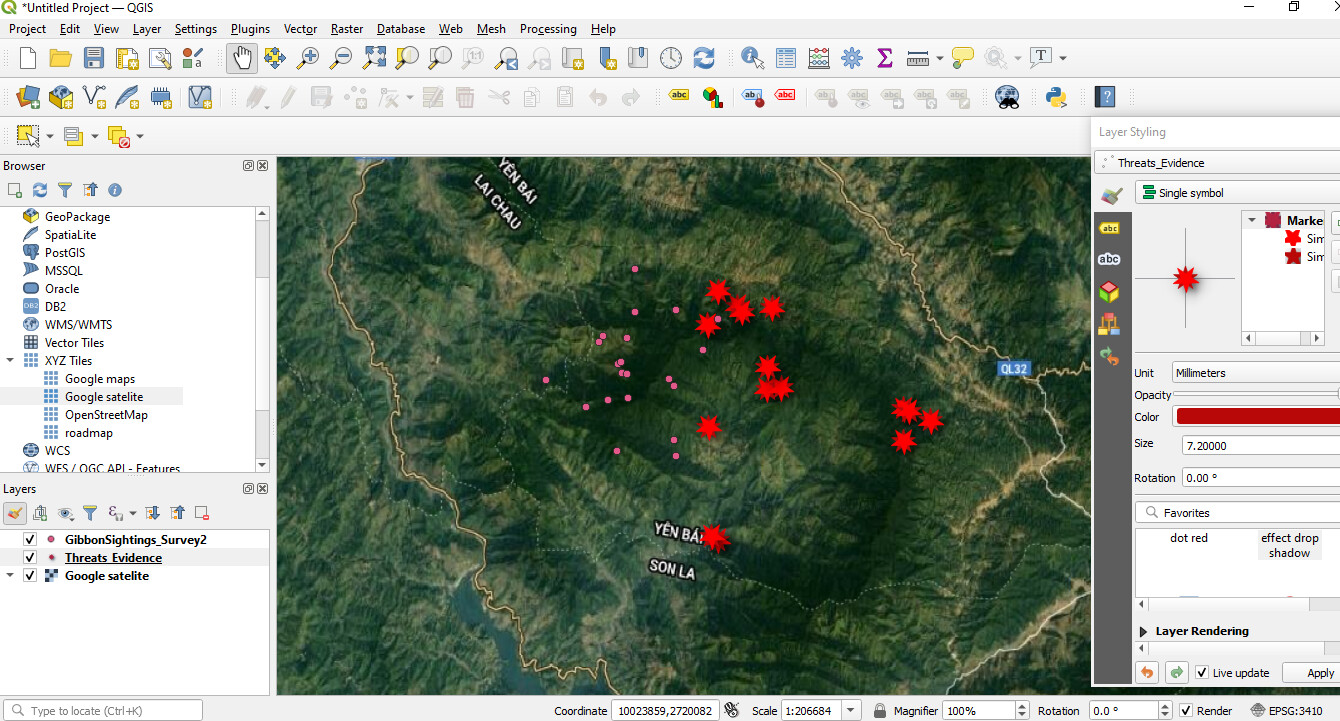
Hi @slschumann,
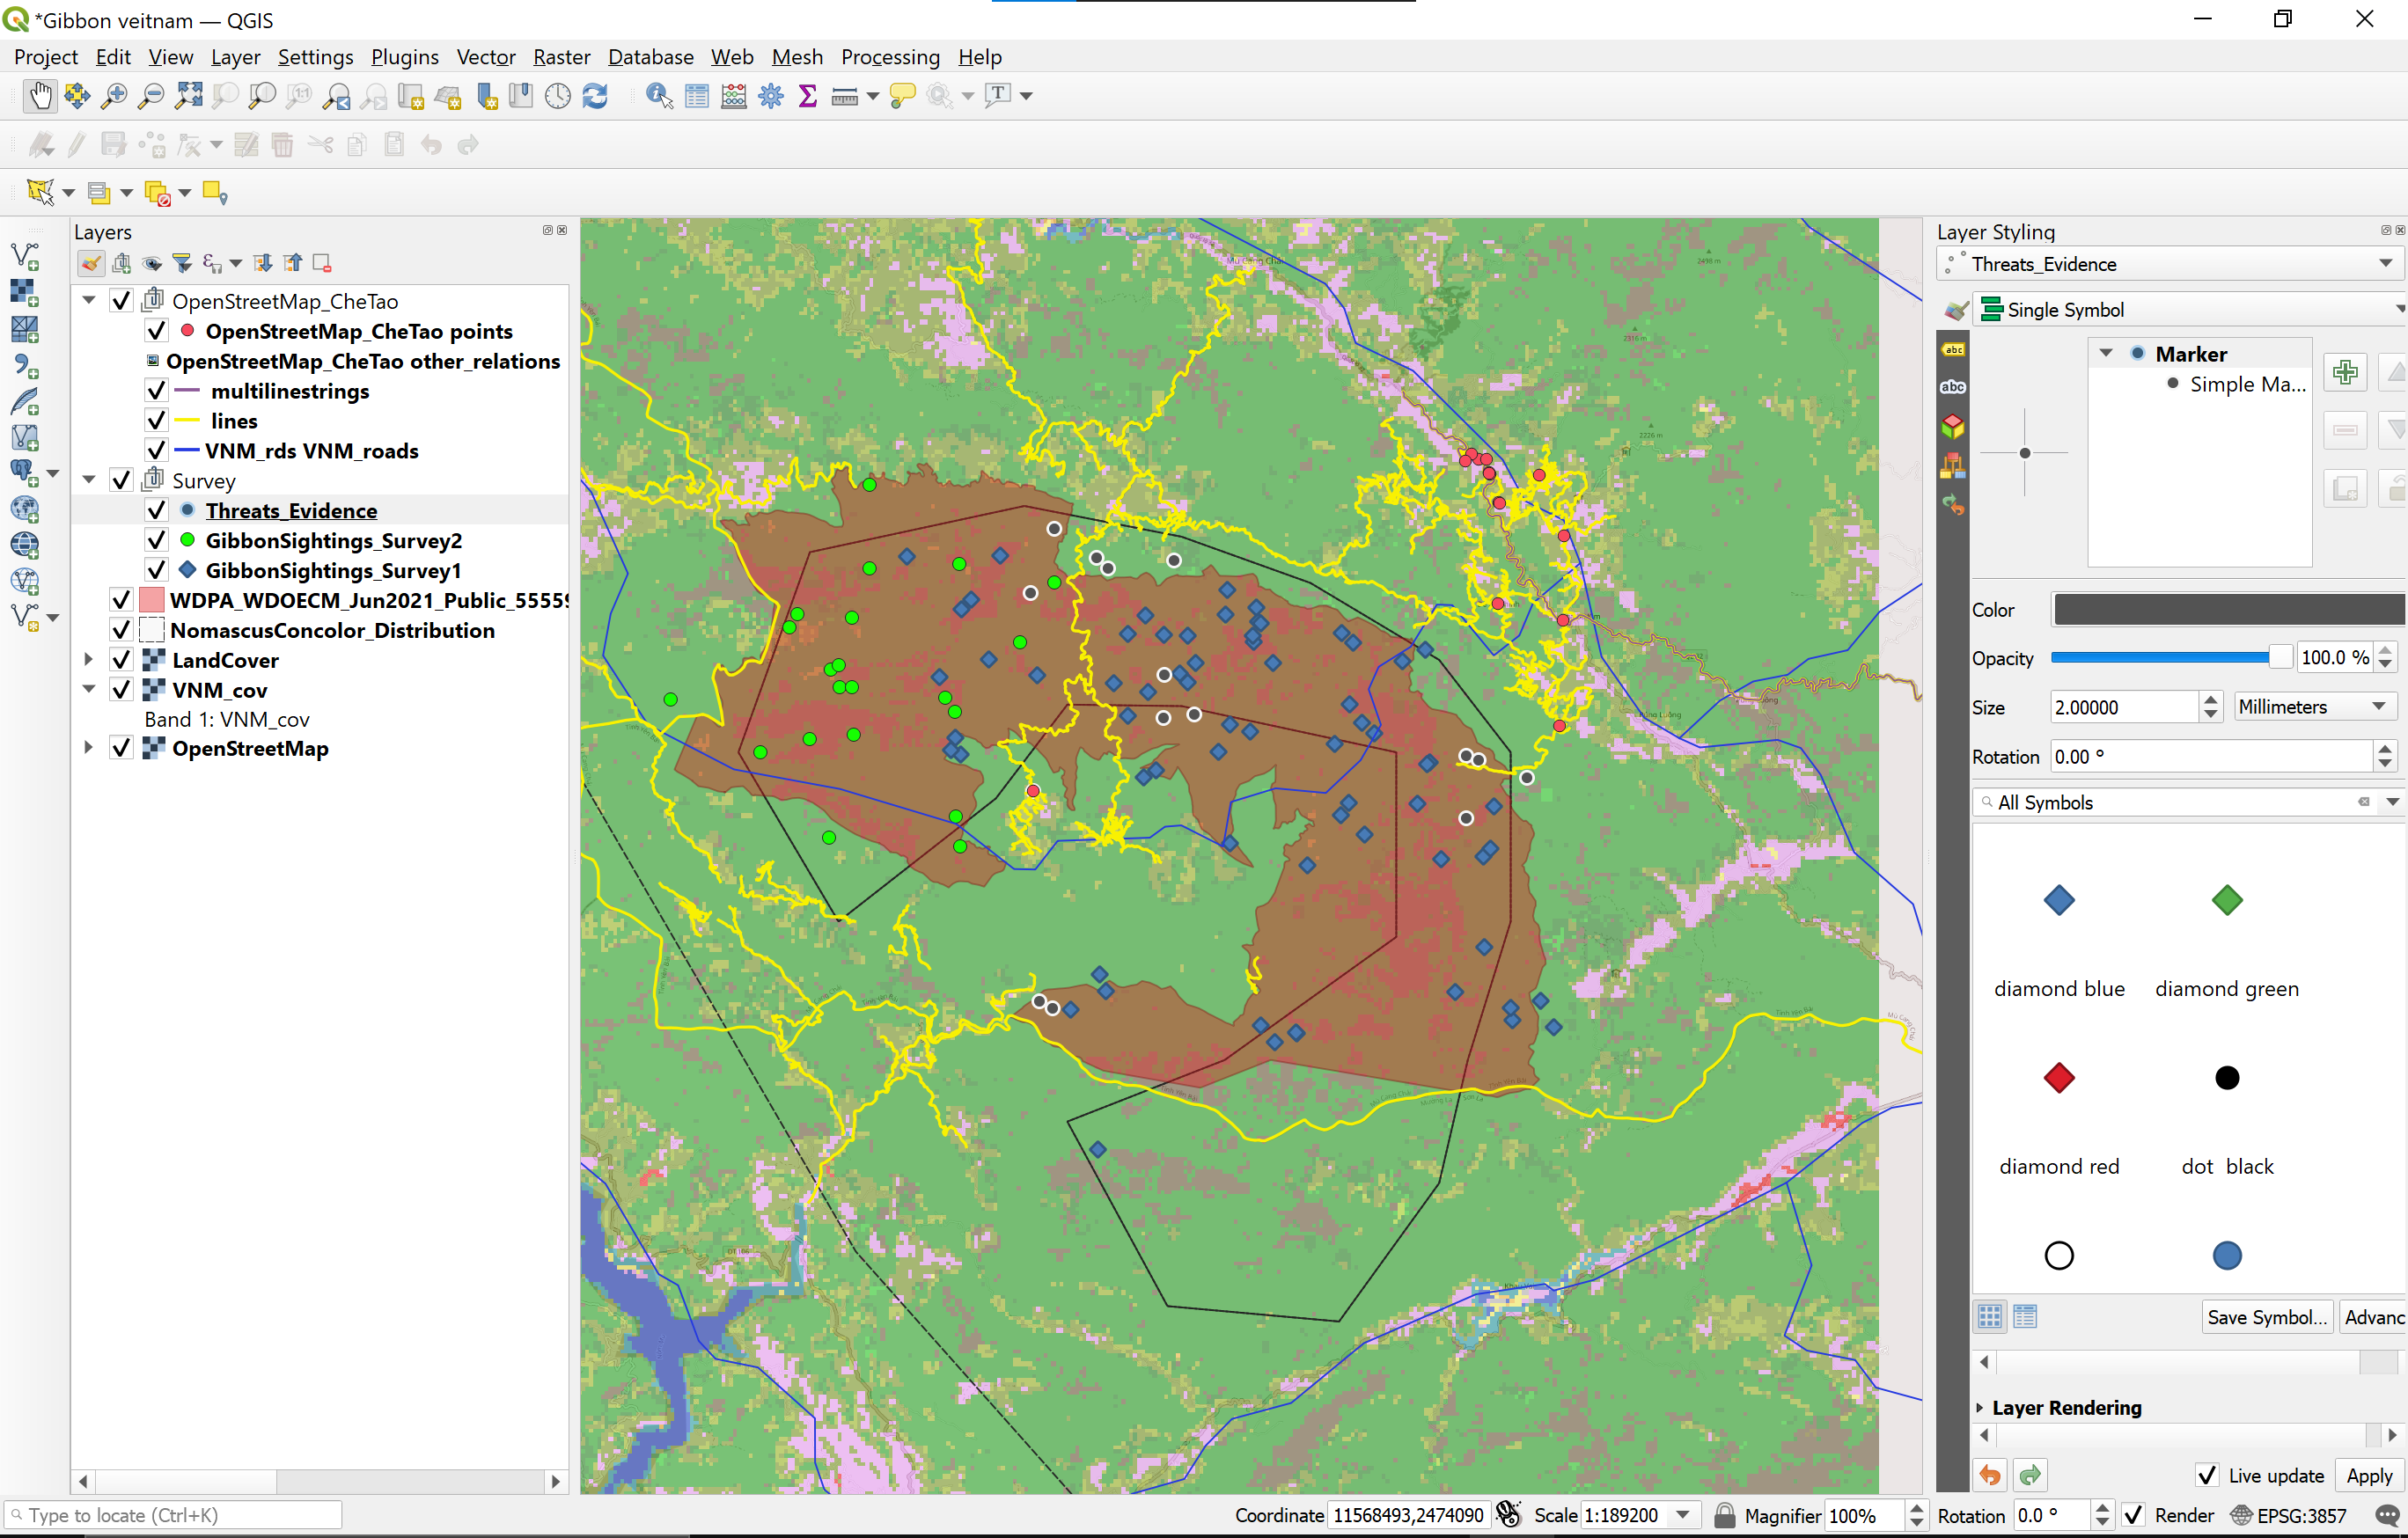
You may try to add the threat points and move the thread point layer to the top of the landcover map. As I have only added the landcover from the previous module. Furthermore, you can change the point symbols on the view >> panel >> layer styling settings - you will see a setting on the right panel which is more convenient to edit the vector point symbols
you may refer to the image attached here.
Hope I answered your questions. 
1 Like
Thank you for this Module. I learn so much from here. It was a nice challenge to work outside of what you know and get to explore different SRS.
I have went through the other submissions and have noticed that there might be something wrong with mine. I am not too certain where I went wrong, perhaps if someone could assist me with this.