Your Project is so pleasing to the eye. Very neatly presented. Super cool !!!
This is my screenshot. I found this fairly easy to follow and pretty sure I understand about the different SRSs, I’m just looking forward to being able to get my own field data and use it myself. It was good to know how to import data from a .csv file. I think this module will certainly have helped with that, thank you.
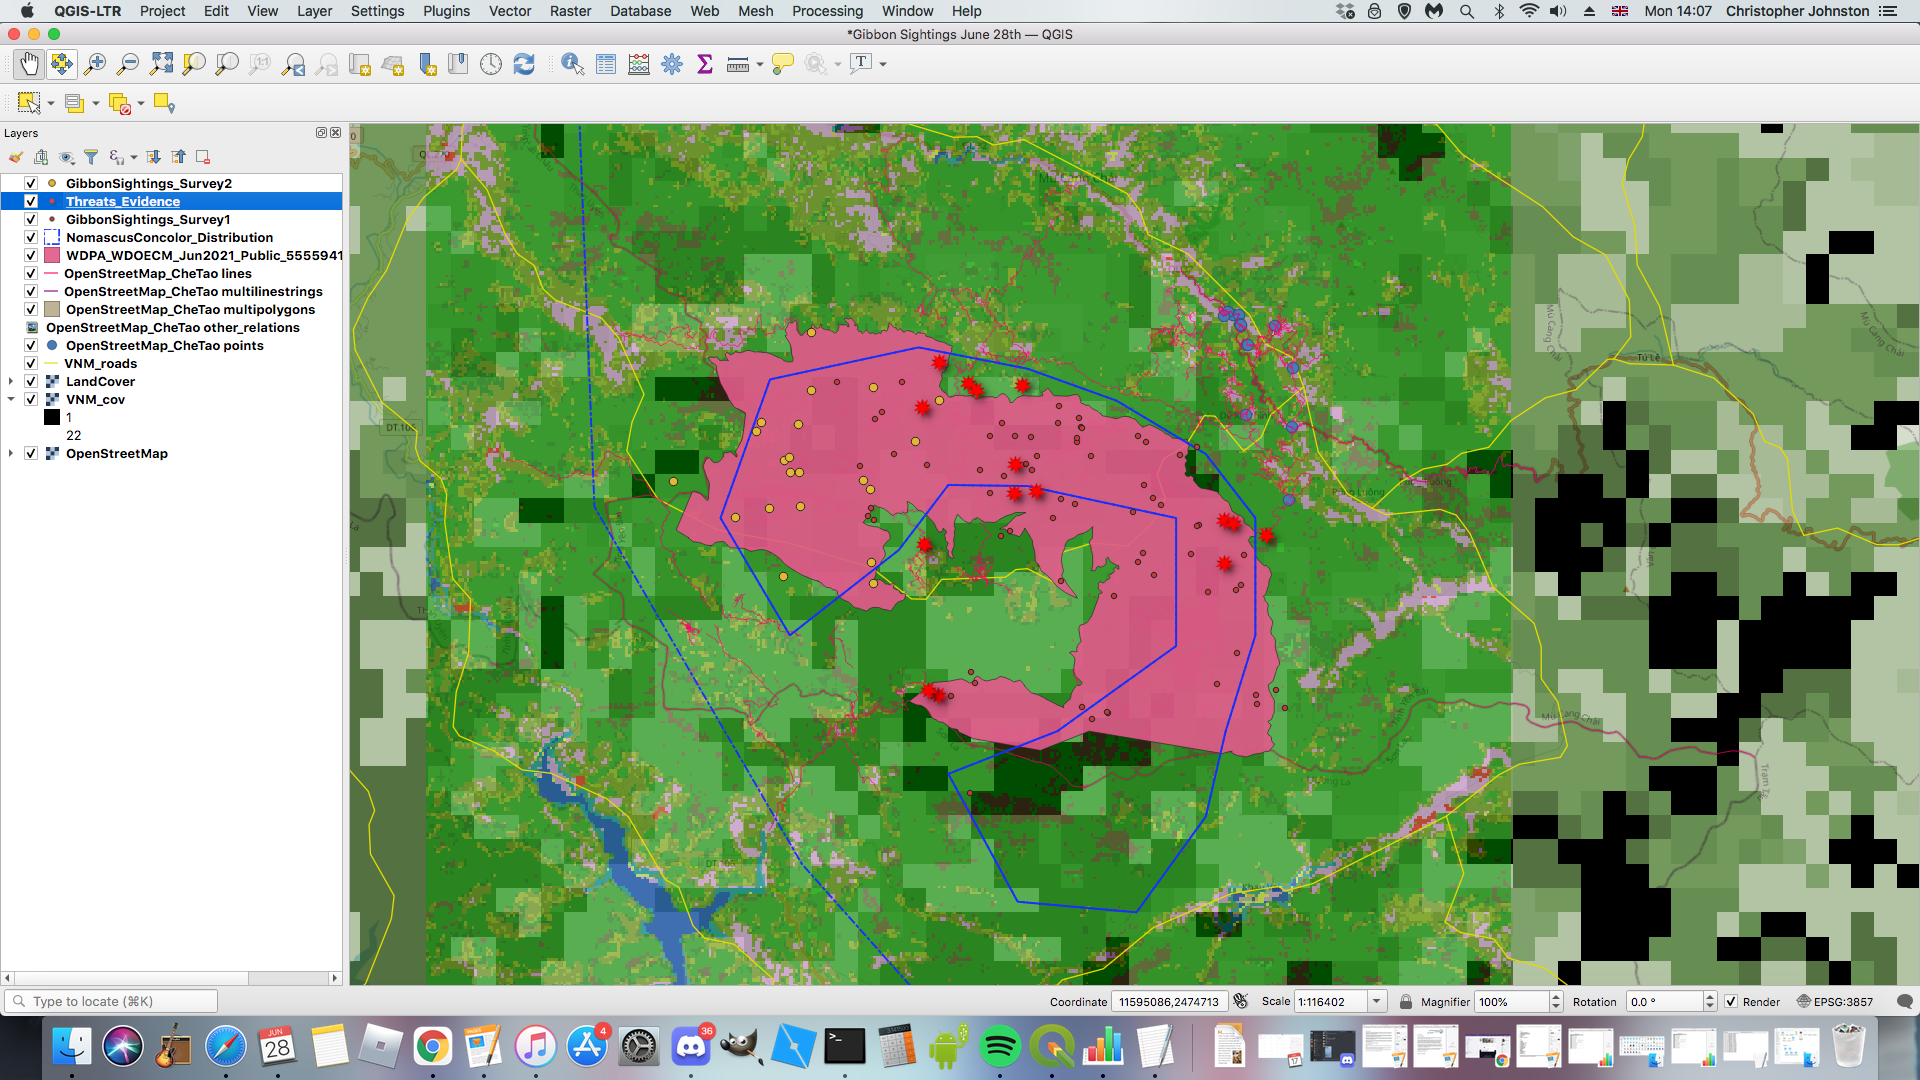
I can see where you have the points for the GibbonSightings_Survey2 but not the Threats Evidence. (May just be me!) Perhaps change the symbol for the Threats Evidence to something else? Something that contrast with the symbols for the two Sightings layers?
Otherwise, looking great and you seem to have got the layers in there okay 

This task was interesting, I really enjoyed it. Despite of the fact of familiarizing with new terms (many of them a little confusing) It wasn’t hard to solve because the exploitation was very clear and full of concepts, tips and examples about how to do it correctly. There’s a lot material to search and to continue to learn through this guide.
Thanks Lucy!! I really appreciated this course <3
I gained a fingernail grasp of the different use-cases of various spatial reference systems.
I tried importing a .kmz in QGIS as part of a short-lived side project. It seems like that isn’t possible, which saddened me as most folks send me coordinates in that form. I’m still struggling to bridge what I’m learning about QGIS with my side-job, which involves dealing with people’s .kmz’s.
Yours is pretty. Nicely done, I think you have an eye for this. My friend who works with GIS a lot says he primarily uses it to make informative and visually appealing maps: something you appear to have a knack for.
You right!! I’m agree with point of view and nice job!
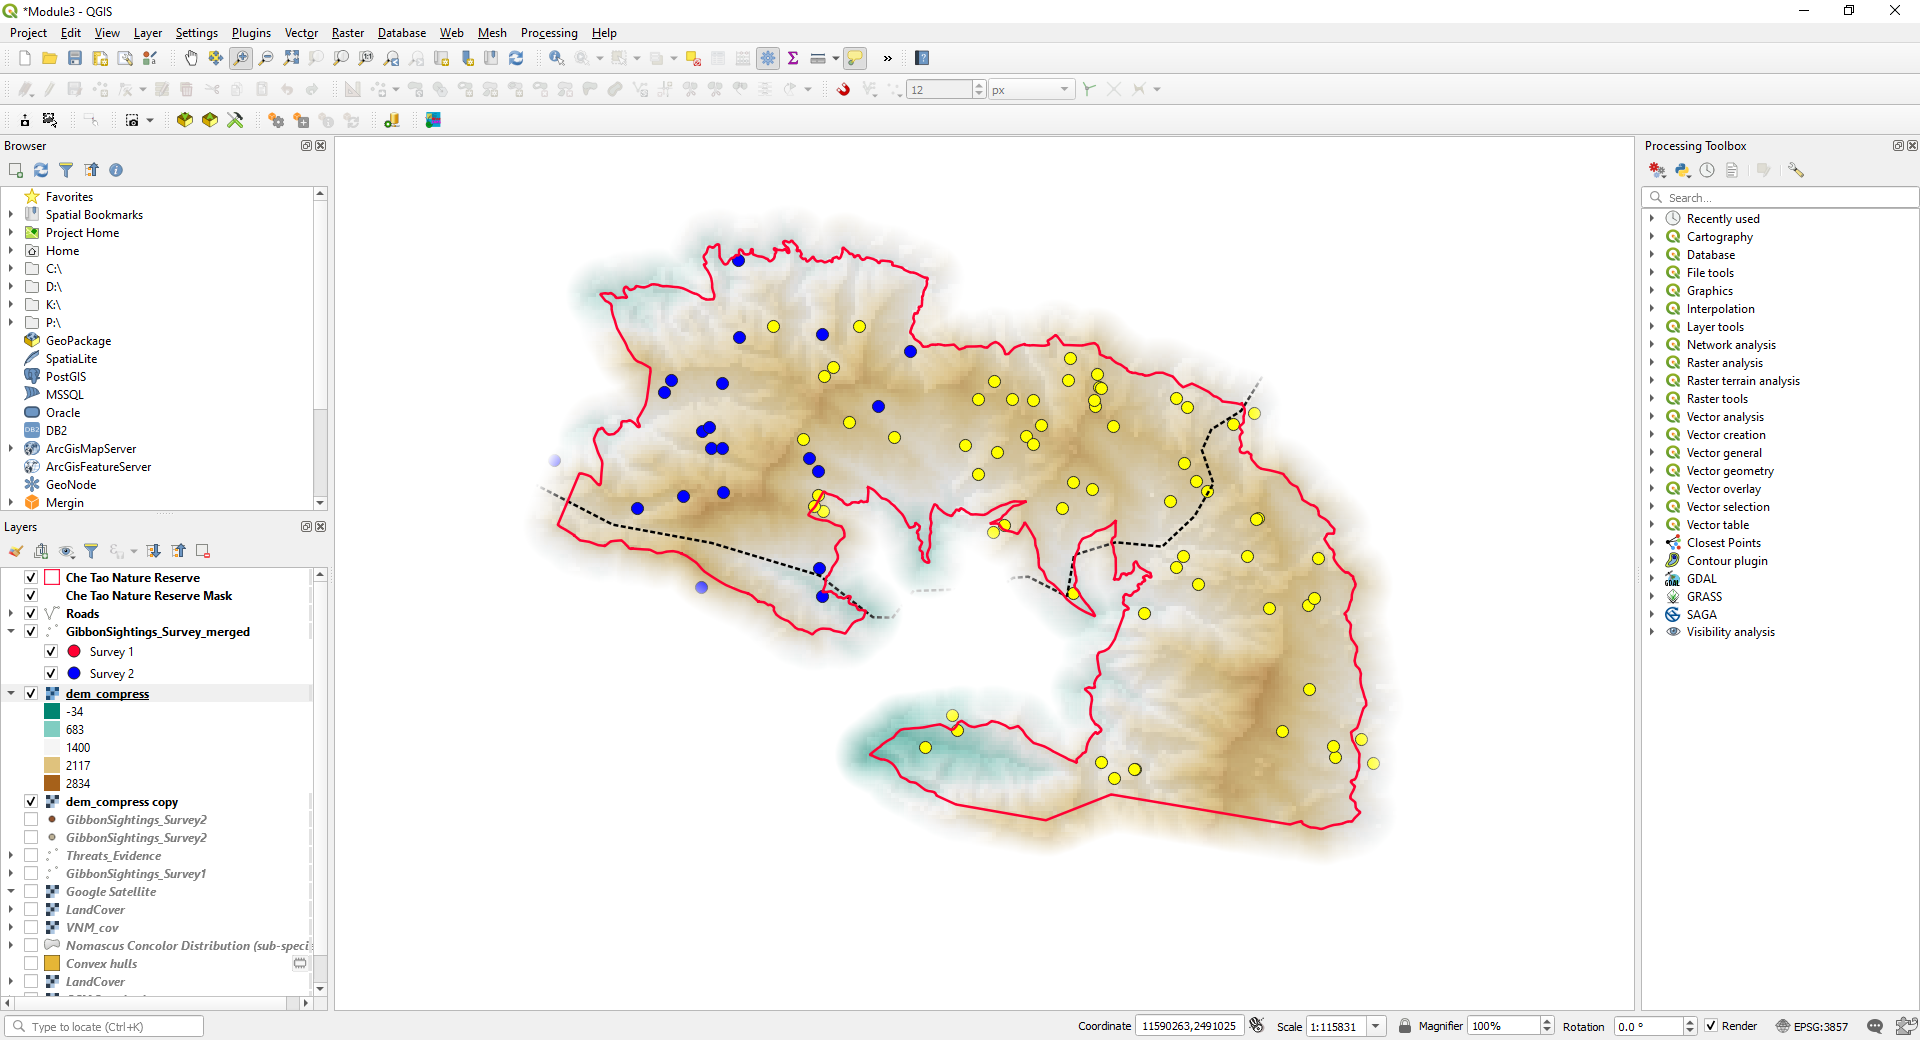
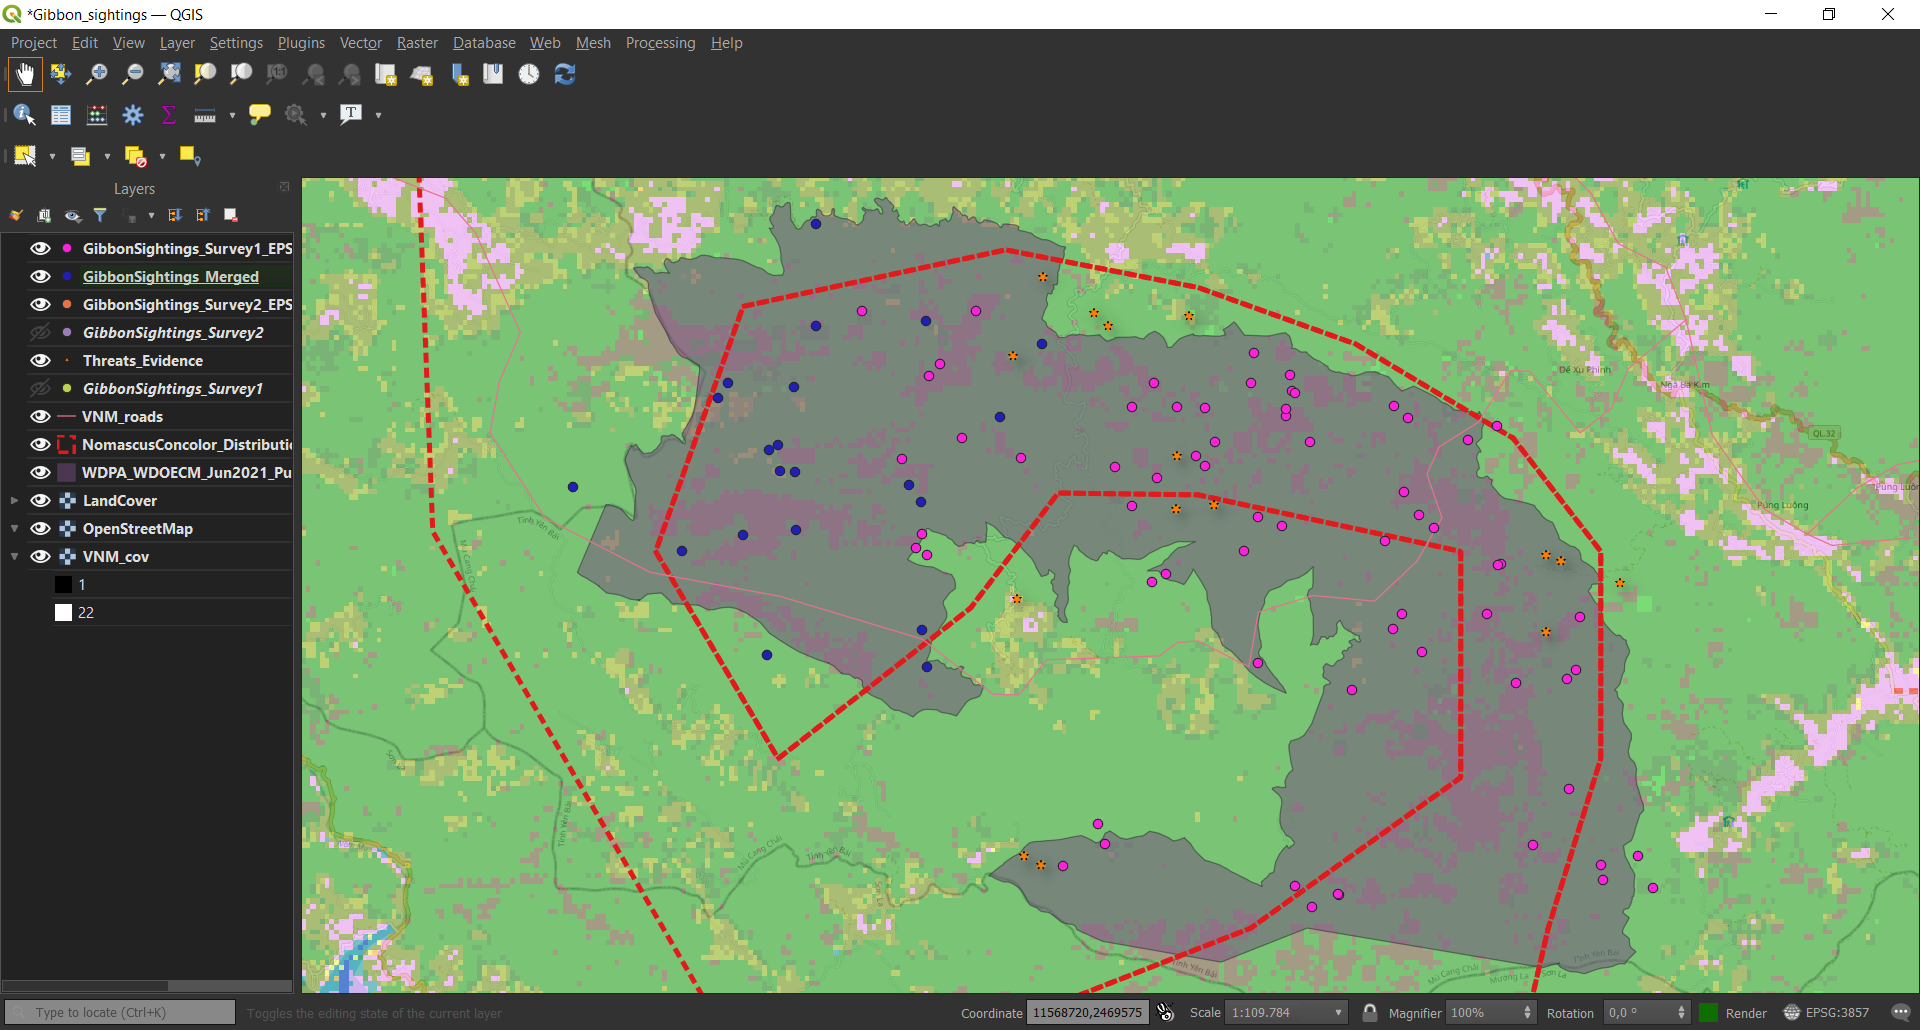
Here is my submission for the Module 3 exercise (building on my previous version for module2).
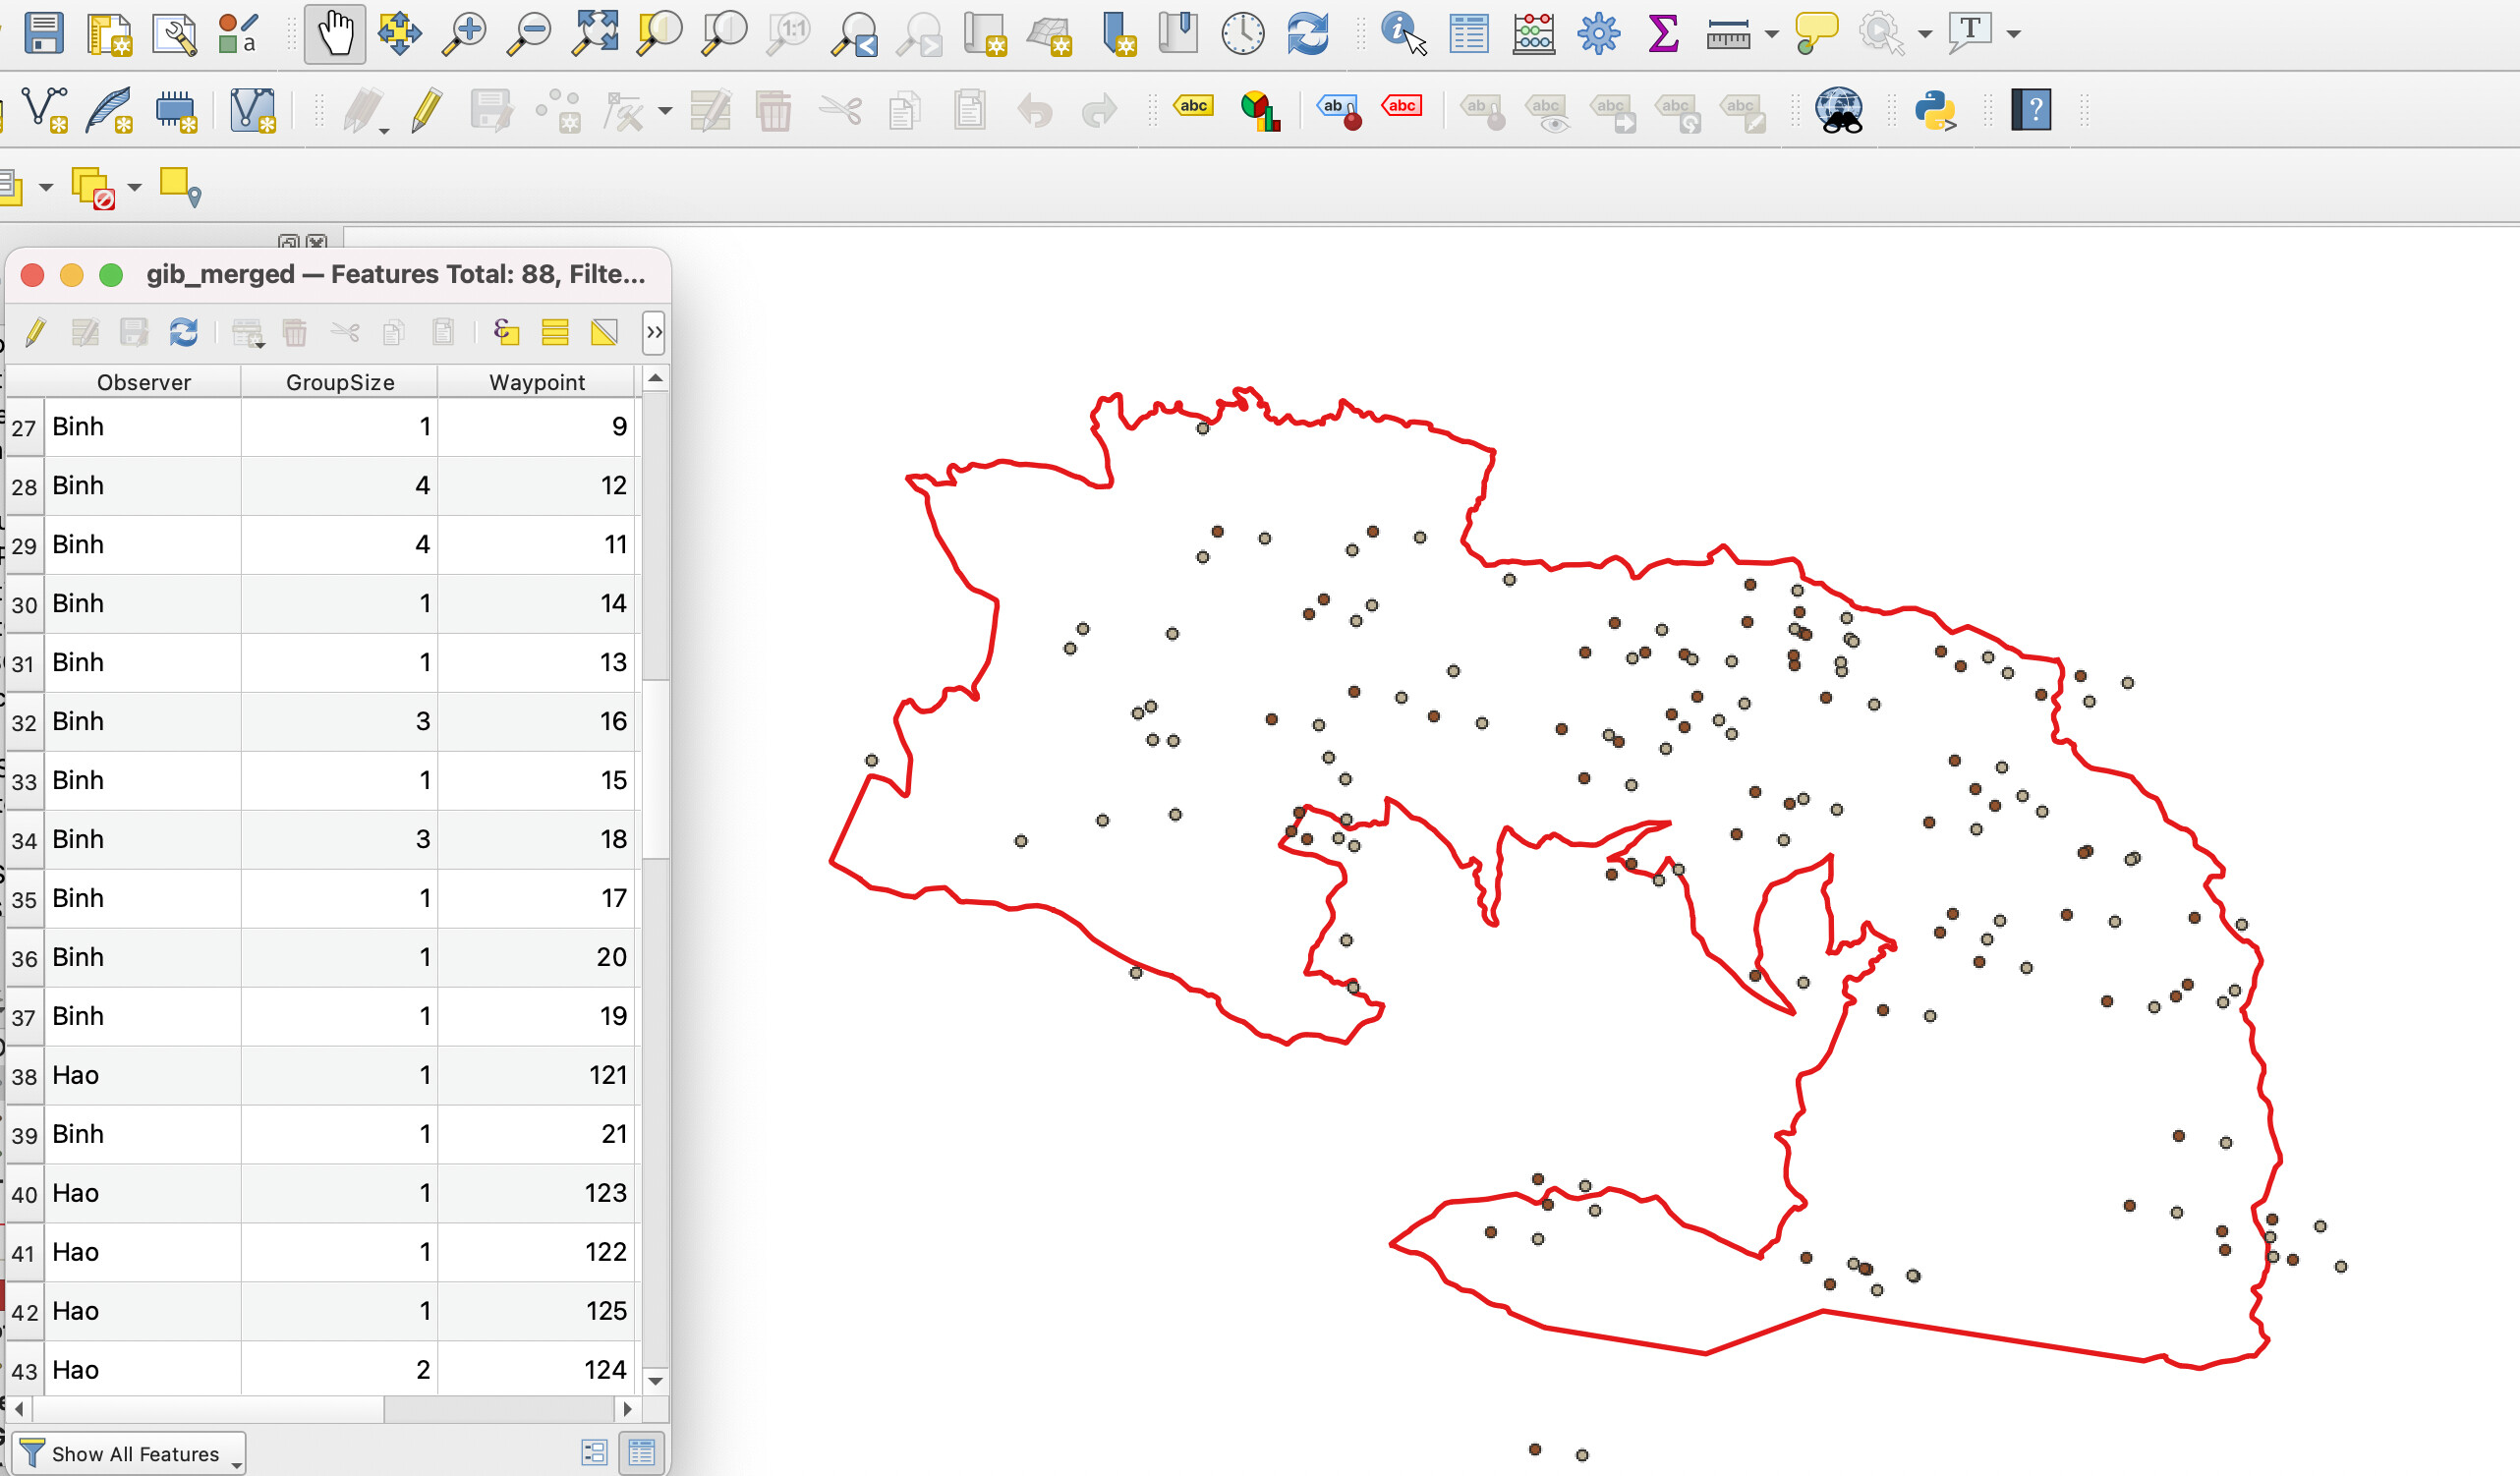
I’ve merged the two sets of Gibbon sightings and created a “Source” field in the merged dataset based on the different “paths” of the consituent two files that were merged (ie identifying survey 1 or survey 2) then used this to classify the combined single survey sightings shape file.
I’ve also added a “hill shade” underneath the DEM layer (which has an 80% transparency to it), and also “duplicated” the nature reserve layer and set the symbology to this to be an “inverted polygon” with a shapeburst fill on it to give the “feathered edge” effect tot he nature reserve boundary.
4 Likes
HI Mishb - it should be possible to import KMZ/KML files into QGIS (I do it all the time!). It may be an issue with the CRS system you have specified as KMZ from GoogleEarth uses the Pseudo-mercator Auxillary sphere projection.
This is great to know! I found this session really interesting. I had a few hiccoughs but figured it out.
Very cool map, I really like how you cut out the elevation!
1 Like
A general comment about using CSV files - make sure that there are no spaces either within the field names, or at the beginning or end of the field names. Spaces at the end of field names are really hard to spot so use the Excel “Trim” function to avoid unintended spaces.
Also, Excel spreadsheets you get supplied with have often been “prettied up” which may involve extra rows before the column headers or column headers split over two rows. Re-format your excel data before creating the CSV file or use the Number of header lines to discard" option when importing the CSV file to skip the unwanted rows.
1 Like
Thanks Jonathan, that’s good to know. All the tutorials I’ve found online quickly dive into QGIS esoterica, so I still haven’t managed to do it, but its good to know it’s possible. I’m on v3.18, maybe that has something to do with it.
The concept here was outlined clearly, but obviously requires a lot more thought and research if going to manipulate our own projections and SRS! I followed the guidelines well and found it very interesting, although I think for the time being I will be sticking to the standard WGS 84 system. No problems in following this module, and almost feeling ready to start with my own data.
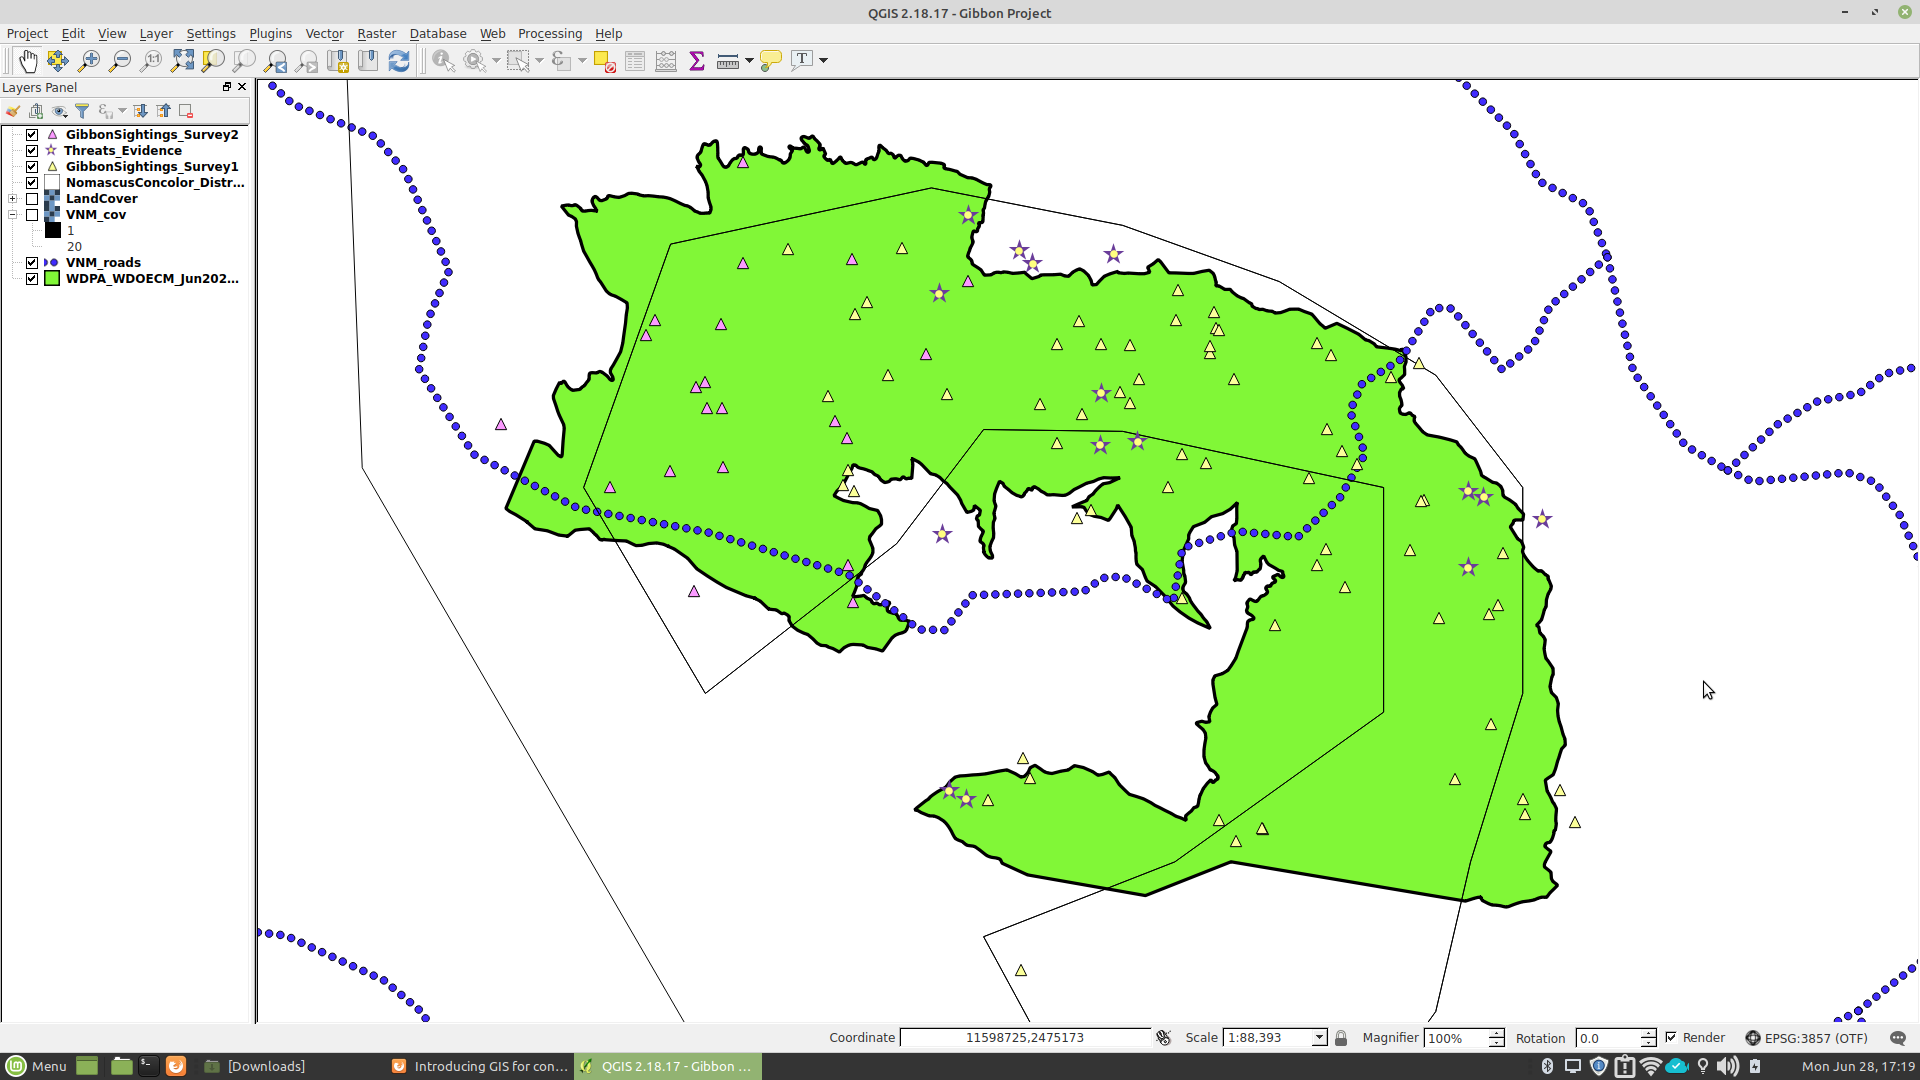
Having looked at other people’s screenshots I see that I seem to be the only one with a merged sightings layer and have turned off the sightings 1 and 2 layers. Maybe I misunderstood something?!
Thanks, that’s very useful to know!
Great map and I agree that the steps here were easy to follow and clear. I also made my threats points stars to make them stand out.
1 Like
Hello there? Thank you very much for your encouraging words. For the suggestion you gave me on the colors of the two layers, I’ll choose different colors for them. To answer your question I’m working in the Afroalpine area of Ethiopia where different highland plant species exist with vast coverage harboring many wildlife species like Ethiopian wolf, Chilada baboon, the Minilik bushbuck and lammergeier all of which are endemic to Ethiopia. Besides, there are two parks and two community protected areas and one critical area recently identified. Therefore there are more Raster data sets compared to vector ones in my working area. Does this answer satisfy your question? Thank you once again!! BTW, I also saw your post and found it interesting. keep up & keep in touch. Cheers!!
Brilliant work, @YWChan !!! I really like how you have edited the LandCover layer! Can I ask how you did it? I don’t guess it easily looking at the properties of the layer on my QGIS project.
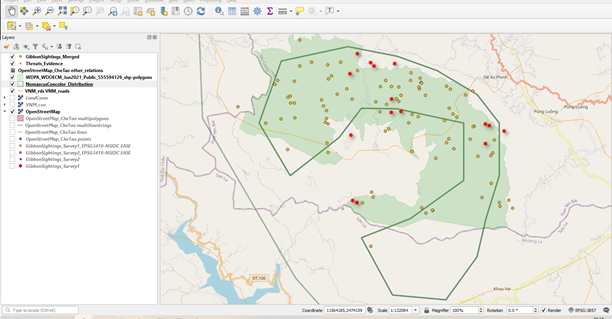
Very good use of different symbols/colours to show the gibbon sightings and the threats! Personally I would avoid to use yellow though, considering that you have already a yellow background, and I would use the same symbol for the two datasets of sightings and the different symbol for the threats instead 
Hi @mamushmiss , lovely map, so neat!
I agree with @angelalquiros , placing the Reserve boundaries on top of the original Gibbon distribution is a really good idea, plus I love the fact that you used for the background of the Reserve boundaries a colour that is very similar to the main one in the surrounding LandCover layer!
For some reason I’m not able to open your assignment and see it at a higher magnification, so I might be wrong in what I see, but I have the impression that you used the same symbol for both the two datasets of gibbon sightings ad the threats. May I suggest to use a different symbol for the threats? I think it would help better differentiate the data. Brilliant work anyway!!!
Once again, I think that also this module has been easy to follow and full of insightful information about the different types of reference systems (and the reasons why there are so many!) However, I feel now more than after completing the previous modules that I need further information to fill the many gaps I still have about GIS, and for this reason I am really grateful to @LucyTallents for the directions to additional resources given at the end of the module and throughout the course!