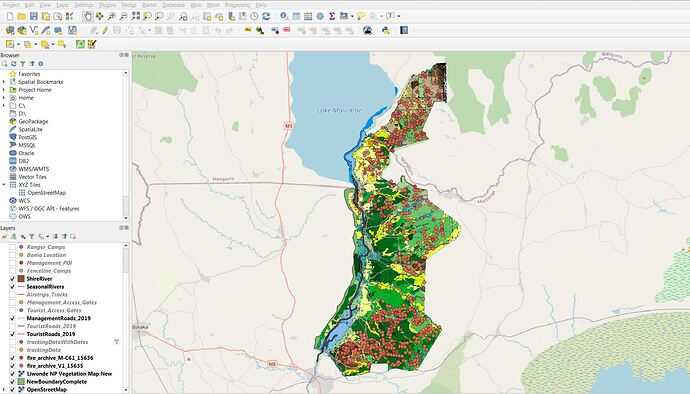
Hi Laney I agree with you, this module was very helpful and the resources named in it, too. I also encountered problems with the layes panel, but was able to fix a few of them. Your map looks great!
I really enjoyed this first module and assignment, the instructions were clear and easy to follow and I have not encountered any problems thus far! Starting the course on such a positive note has made me feel confident and excited for the rest of the course!
I agree! I also did a QGIS course before but never used the ‘insert XYZ layer’ function until now - I think it’s great feature. Well done on your map and good luck with the rest of the course!
This introduction has helped me to pick up a lot of little tricks that I had forgotten in navigating in QGIS. The instructions are so clear and easy to follow too!
Hi Nangamso. They say QGIS is more user friendly than ArcGIS! Please tell me what tyou think about that as we progress.
Hi Michael.
SHapefile data for QGIS always comes in those 5 formats, otherwise it does not work. if you only have the .shp file, you will be unable to add it to your project.
So far the Module has been straightforward and easy! I ran into a little snafu with the interface design but realized QGIS wasn’t fully updated and it was fixed once I downloaded the update. Week 1 has definitely taken away the fear of GIS for me. Can’t wait to experiment more with agriculture data!
I like this idea! looks good! I might also do this for mine as well
Hi,
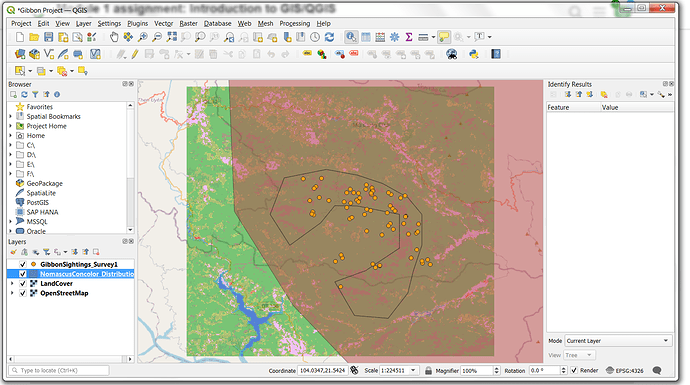
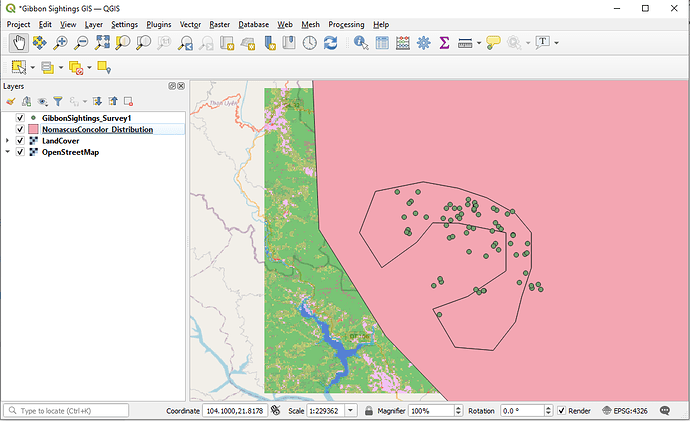
Feels great to be making progress thanks to your clear instructions. The opaque distribution map blocks the other layers but I found that I was able to make the layer transparent by R. click on layer, properties and select transparency. I would like to know websites where we can find other maps and satellite imagery to create new projects.
What a fantastic first week! I remember the last time I took a GIS course, one week in I was intimidated by the amount of information. However, this was explained in such an easy and understandable way that it made me want to keep going. My learning goal is to understand the basics of GIS as I am coming in as a beginner and I feel like with Module 1 I am already there. I worked with the provided data, which made it easier. I do not feel like I am ready to use my own data yet, but I am confident I will get there before the end of the course!
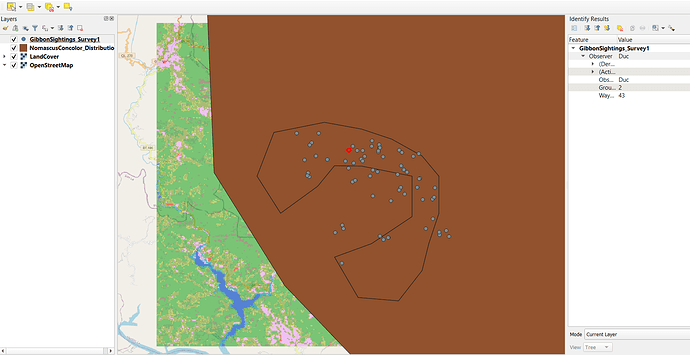
The only problem I encountered was in the Inspect Data submodule. When I clicked on the Identify features, the selected date would highlight in red and remain highlighted while I wanted to keep working on it. A quick Google search and I was able to discover the “Clear Results” button (under Identify Results), which brought everything back to normal.

This was a very useful module. As someone who was learning qgis towards youtube tutorials, beginning to learn step by step, knowing the theory behind every step, is a great way to introduce the program. I didn’t have any problems yet, as this steps were not complicated to follow.
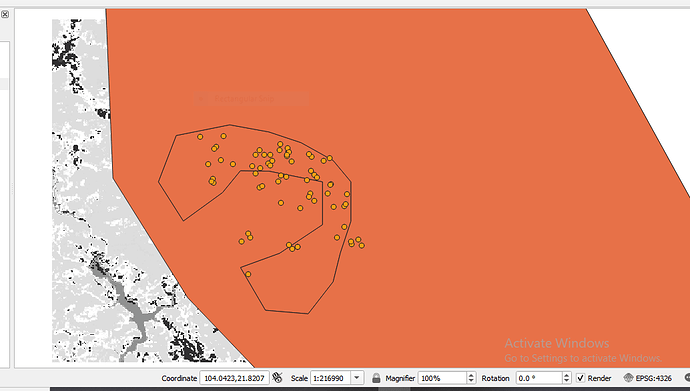
Nice! Looks like the distribution and the points are the same as the rest! But why is the map of the background black and white? It would be interesting if you used another kind of map than openview.
Fantastic job completing the assignment! The only suggestion I have is cleaning the toolbar up to work with easier but it seems like you have a clear grasp of what most of the buttons are for so that may not be an issue for you. Also, thank you for sharing how to change the transparency of the layers! It does make the data look more visually appealing and I am eager to give this a try.
Hi Jonathan,
I would definitely like some help with adding data through Excel. How do you make sure the coordinate systems are the same or aligned so the data doesn’t get lost on your map?
I have another question… do you know why the base street map is added as a XYZ file and not a vector or raster file?
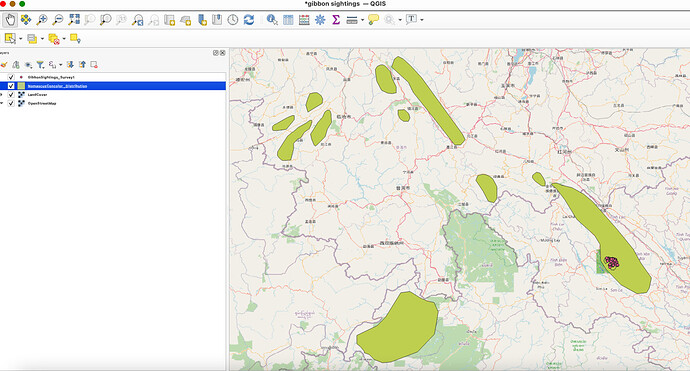
This is a fabulous way to view the map. All the layers are clearly visible. I didn’t realize you could view the subspecies this way.
How do you create an “inset map”?
Hi, I am Jemmy, this module 1 is very interesting and easy to understand as well as practicing. The version of my QGIS is not the updated one causing to be difficult to add layer of XYZ, but i solved it by adding it from browser.
Hello everyone
I’m Percy Ntshiuwa from SA, I am a Field Assistant in Sanparks for Biodiversity Projects under Working for Wetlands project and GIS is a requirement for the job.
I am pleased to join this platform and im looking forward to learn as much as I can from you all.
