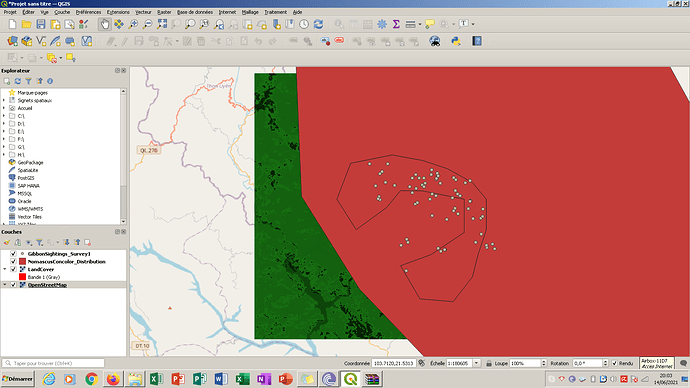
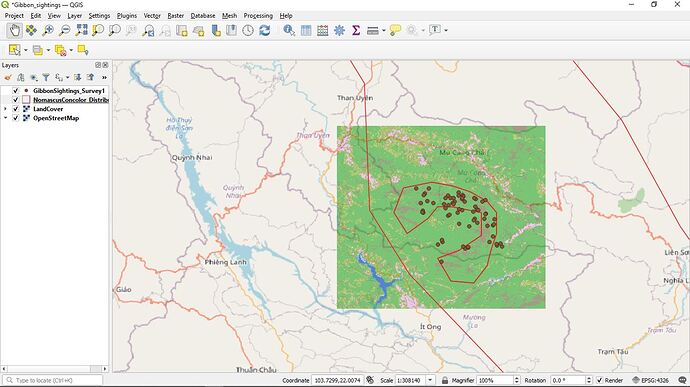
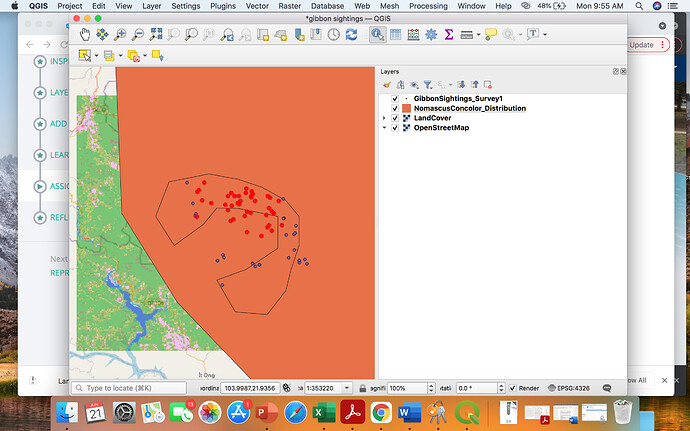
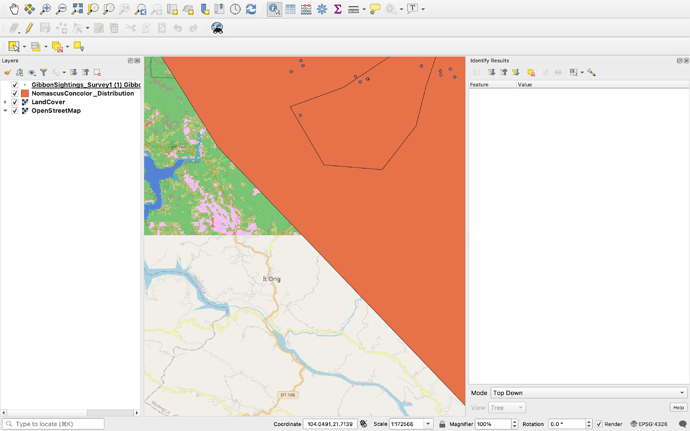
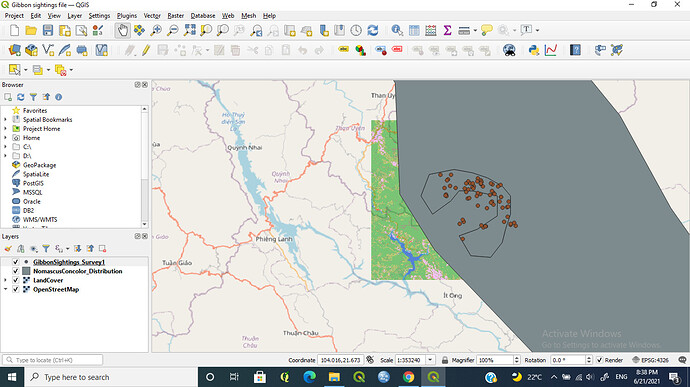
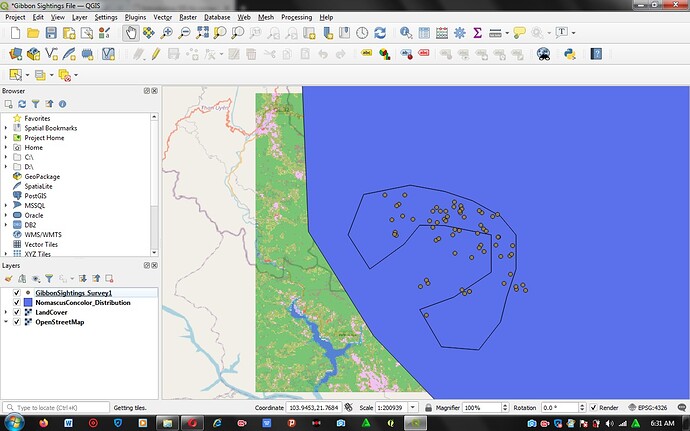
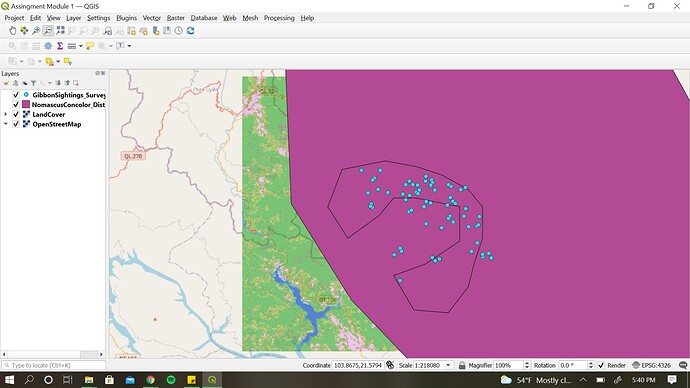
It’s good to hear that you managed to sort the problem out! Good jod @ecaraker , your map looks good!
Hi everyone,
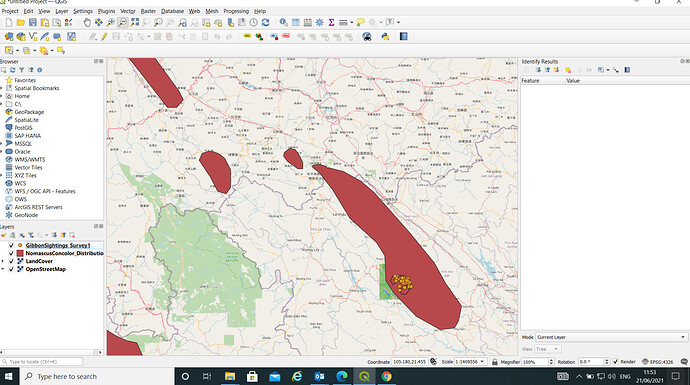
I’ve just finished my first project ever in QGIS and I’m really happy! The module was incredibly easy to follow, every single step was clear to me and designed in a way to make intuitive the next phases of the work. I was starting from scratch and now I can confidently edit panels and toolbars in QGIS, insert datasets into the software and use them to create maps in combination with other maps downloaded from the web (learning also where to find them online!).
I’d really appreciate it if anyone would point out any mistakes that I might have done without realising it, thank you very much!
I’m really enthusiastic after this first QGIS experience and I look forward to going through the next modules of the course!
Oh! Well done Jean, very beautiful map! Can I ask you what your data represent?
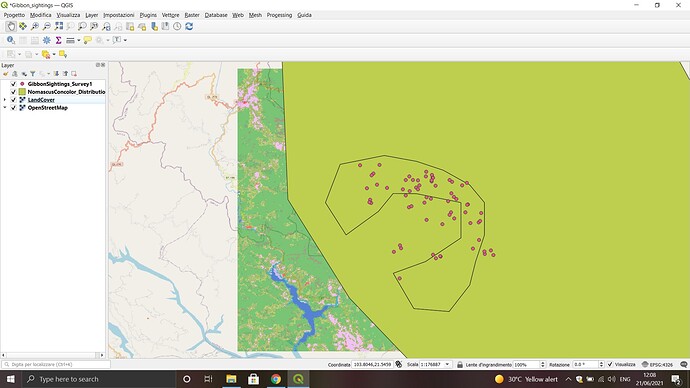
Great work Greg, lovely job you made making transparent the polygons! Not sure I understood how you did it though: did you say you used R and not QGIS to do this? I don’t seem to find the option ‘transparency’ in the properties of the layer. It would be very helpful if you could give more details about what you’ve done, thank you very much!
The instructions for this module is really clear and easy to follow. Somehow, my version of GIS (v3.12) did not have XYZ layer option in Add Layer. Instead, I found it right at the sidebars. Other than that, I did not face any other issues. Clicked around to explore and found the option to change the colour and transparency of the layers. I really enjoyed this module and am looking forward for the next session.
nice work there ekole
The instruction is very simple but need constant practice to use many of those tools.
Thanks for this unique idea.
Ofcourse. Sorry, I forgot to add that here. The data represents fires recorded in a park over a 1 year period (2018)
Oh wow, so many  thank you very much for the reply, Jean!
Hi Thanisha,
I liked this idea, where the MomascusConcolor polygon is not filled and you can see the other attributes of the below layers. I am happy that you figured it out by yourself.
With Regards,
Rutuja
Hi Everyone,
This module was really helpful. It did clear misconception about one can’t overlay vector and raster file in one project. Also, I got to know about different file formats.
Thanks & Regards,
Rutuja
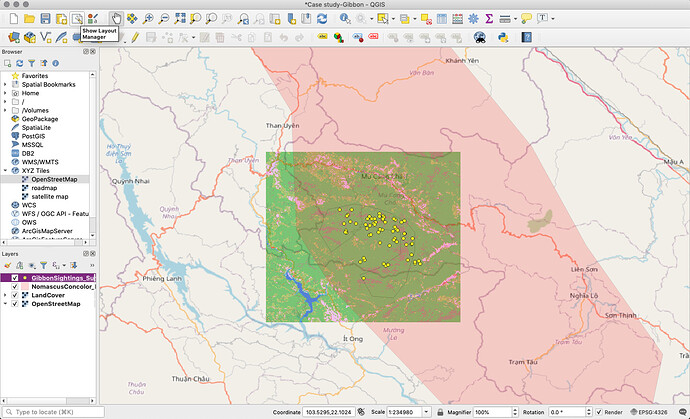
For this first module I have created a nice little map of gibbon sightings from the sample data. I familiarized myself with some of the toolbars and settings of QGIS. Creating the map was pretty straightforward using the sample data, I was surprised at how easily it came together. I suppose for future, when I am using my own data, I would need clarification on how to save my data (tif/qgz/shp etc) so that it’s correctly imported into QGIS. I have contributed to my learning goal of becoming familiar with GIS so that I can confidently use it in future by becoming familiar with the basic operations of the program and how to arrange and import layers.
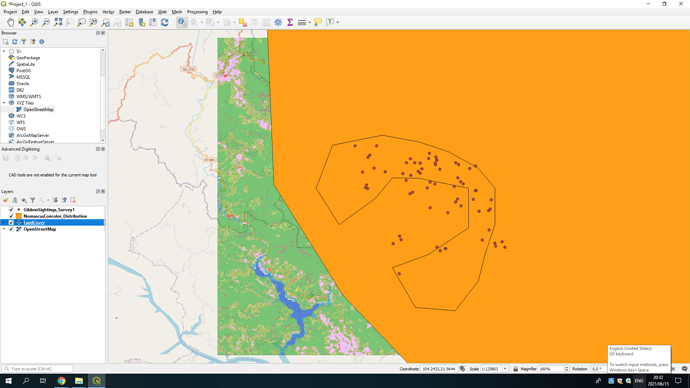
This looks really nice. I was wondering how you were able to keep the ‘backwards C’ shape without removing the Nomascus Concolor distribution layer? That layer for me creates a giant block of solid color that lays on top of the other layers but seems to be necessary to keep the sighting outline shape (the backwards C).
I’d like to apply this to my own map, it looks a lot cleaner and easier to process.
I am a bit behind in the course because I had some trouble opening the QGIS program on my computer. Once I was able to troubleshoot, I found the exercise helpful, although I do feel like the instructions could be a bit more detailed, especially if folks are working on different versions of the program. I will need much more time sand-boxing with the program to feel more comfortable with it, but I feel like I’m on track to learning a lot!
I have been struggling how to add base map to projects. I have like the fact that I was able to add it this map.
However I got confused when I reached the part of “Copernicus global land cover map”. I did not know what to do here though I opened the map but I could not do much. Any one in the community with any idea can help here.
Hello Mates , i am so happy , i managed to submit my first assignment today .I started to do this assignment yesterday and, got stuck because of the version of QGIS , which i was using , but today after upgrading to a better version , i succeeded. I must say this module , was not that challenging , and i find it useful .
If i happen to make errors , on my first assignment , please guys , let me know .
Great work , its very clear .
This was my first time using QGIS and I thought that it went very well because of the clear instructions. This assignment was a good introduction into using GIS/QGIS which has helped me gain insight into how the program works as well as how I can apply it to my learning goals.
The only problems that I had dealt with uploading the files needed for the layers. Initially, the file titled “NomascusConcolor_Distribution.shp” would not upload from the unzipped folder within my file explorer. An error message occurred multiple times saying that the file was not able to be uploaded because it was not in the correct format. However, I managed to upload the file in the end by extracting the file from the zip folder and dragging it into the upload layer text box instead of using the three dots (…) to choose and upload the file. From that point on I used the same technique for the rest of the files that needed to be uploaded as layers for this assignment. The OpenStreetMap layer also did not load for me initially, most likely due to the size of the file, but it worked after a second try. In all, these issues were easy to work around once I tried different ways of uploading files which was a great learning experience. Did anyone else have similar issues, and if so how did you solve them?
