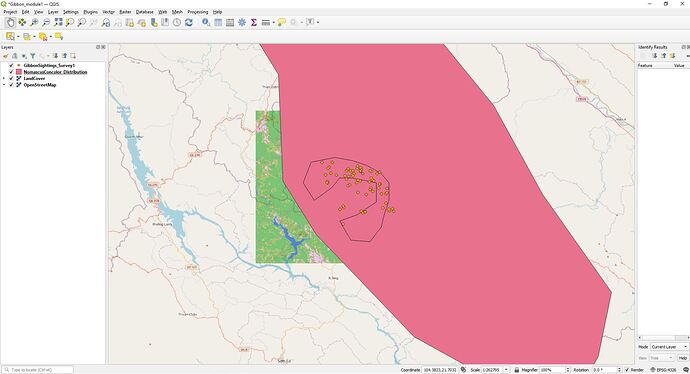
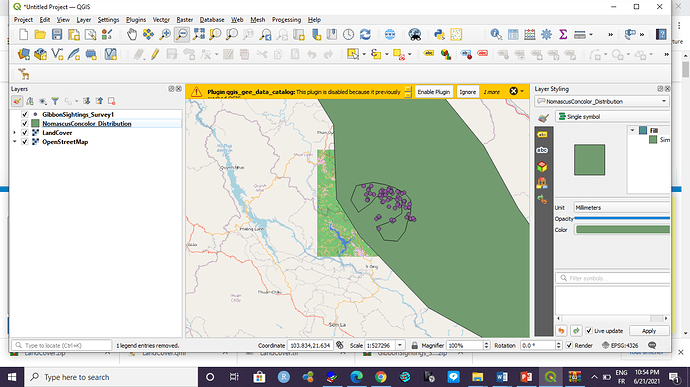
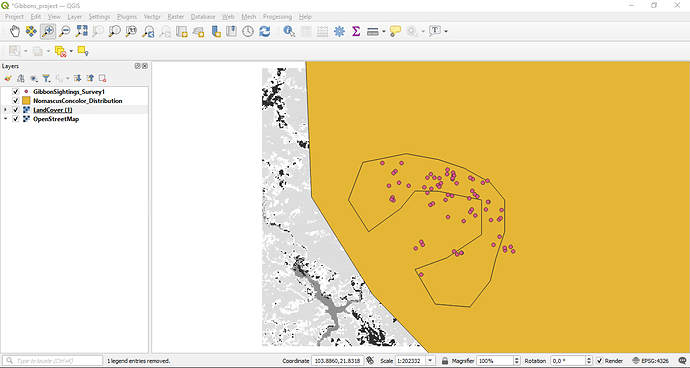
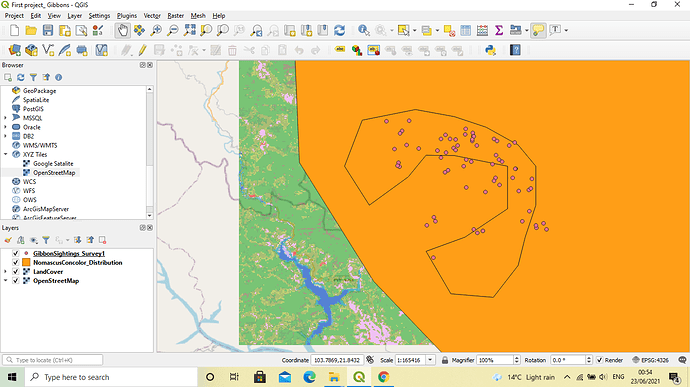
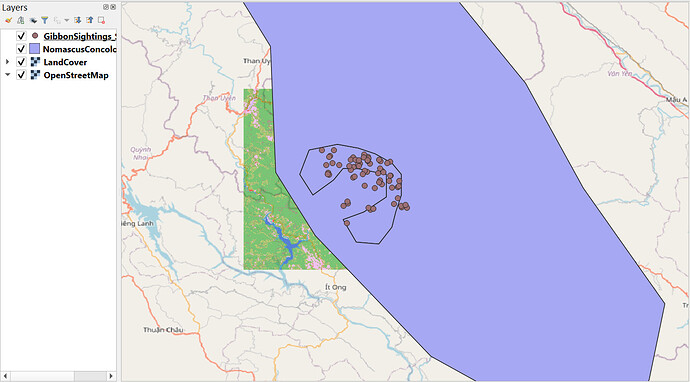
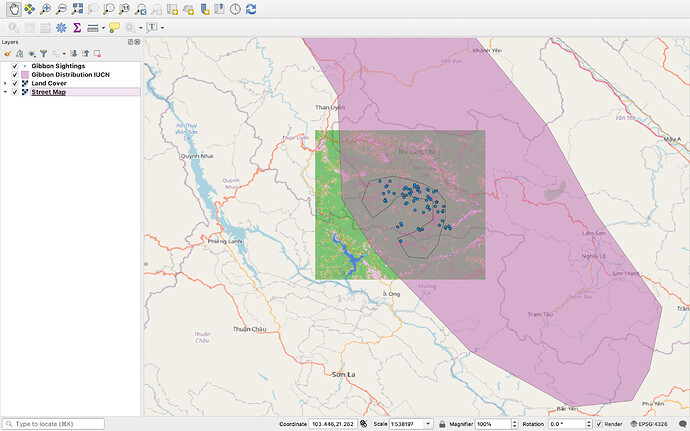
Your screenshot looks great Greg! The transparent layer really works well and allows for one to easily see each distinct layer. In your post you said that you selected transparency under the specific layer’s property, however I was not able to find that. I did notice that the layer became more transparent by changing the opacity, which shows up as slider bar above color and below unit when clicking on the specific layer’s properties. Did you change the transparency in a similar fashion or did you use a different trick? I really enjoyed seeing your post as it spurred me to explore different properties within the layers that could help personalize/organize different layers in future projects.
Great work!
Gabriela H.
Hi Kwyssmann,
Sure, please do try it out. It is very simple.
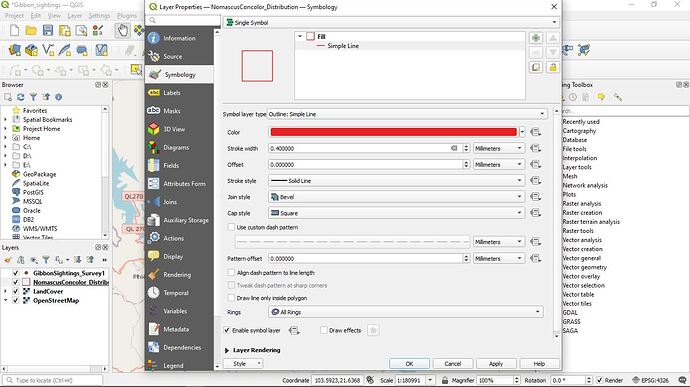
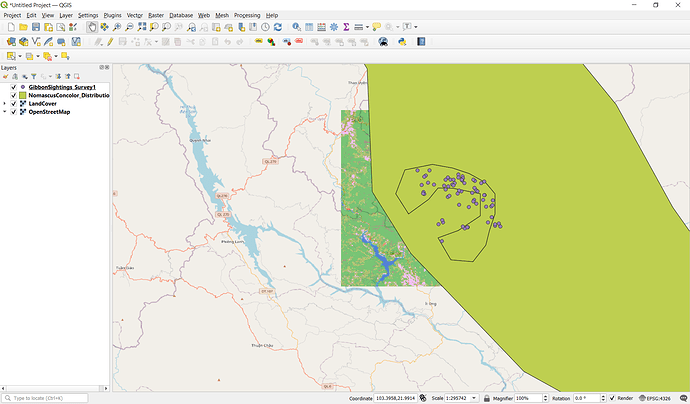
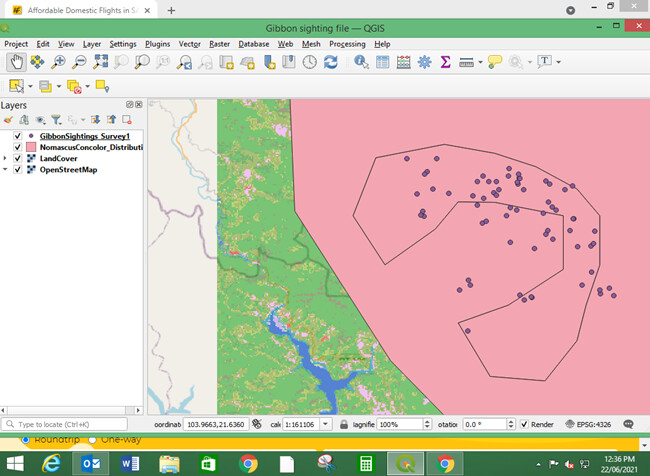
Go to your layers panel → right click on Nomascus concolor layer → go to properties → then symbology → click on simple fill (drop down list will open) → select outline (based on your preference choose color, stroke width etc.) → Apply
Thanks & Regards,
Rutuja
Hi Kathryn,
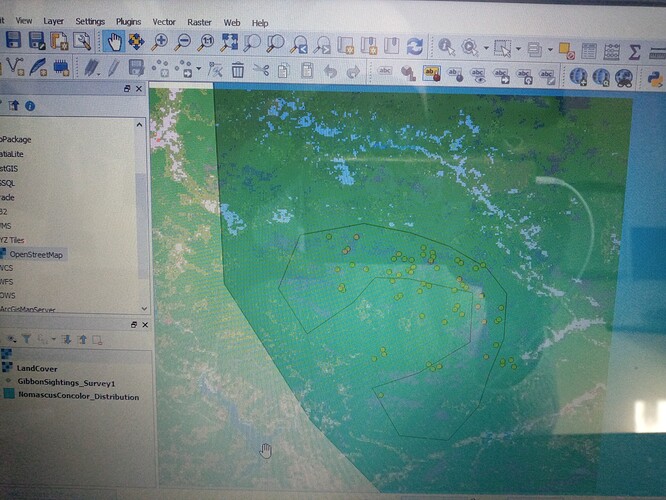
Please do have a look at this screenshot, hope it will you.
Hi,
This module was helpful in learning the basics of QGIS, but i was struggling with adding the OpenStreetMap.
Thank you so much for offering the course. The module is easy to follow and understand. I wonder if the course would cover how to generate the different file formats before loading them into the QGIS.
Cheers,
Maverick
Helo dear mates. Module 1 was very basic and simple to understand. The instructions were flowing and succeeded to accomplish the task easily. The procedure to add the base map.
My Assignment 1, this was an awesome lesson.
HI Greg,
When adding data through Excel, you first have to save it as a CSV file before impiorting into QGIS.
Do add “point” data (eg. from sample lcoations or field surveys), you need to haev two columns in the spreadsheet for the “X” and “Y” coordinates (eg. OS Grid Reference Easting and Northings, or Longitude and Latitude).
Depending on what co-ordinate system you are using, you will need to select the CRS which is relevant to the co-ordinates you have (eg. WGS 84 for lon, lat).
When you have the points displayed as a “Layer”, you can save this layer into any format you like with any CRS you like, so this is an opportunity to create a proper GIS layer from yoru spreadsheet data with the same CRS as your project.
The base street map is added as an XYZ file due to the nature in which online web service map data is handled. It is a global set of data and there isnt a “single” dataset that is used, it is compiled from a set of tiles which are fed to the GIS software from an external source.
XYZ files are normally used for web supplied data that is supplied as these tiles, whereas adding a “vector” or “raster” layer is usually the way to add a single GIS layer to yoru project.
With the OSM data, there are other plugings that allow you to download and save the OSM data shown in the current extents of the project so you can use this as a “vector” layer (this then allows you to display, extract and analyse any of the OSM data as you would other GIS layers rather than just use as a “static” background map.
Hope this helps
I was quite challenging at first I had to learn first as a first time Gis beginner with no background but I did manage to catch up fast exciting at the end I had to do it repeatedly for understanding.
The challenges I have encountered wath terms that are used in Gis but had to learn them. I learned to follow instructions under wise I would not have managed to do it thanks
If you get unswers, please let me know
Hello everyone!
The first module was very easy for me as I have learnt the QGIS basics before. I encountered zero problems with the work done so far. I pretty much enjoyed the theory session and learning the definitions because it was not something I knew off by heart. Thank you very much for this opportunity!
Best regards,
Ntokozo
Hello Phumziee!
In my opinion, I think your work is excellent, you’ve zoomed in everything perfectly. I don’t feel the need to suggest for any improvement regarding this first submission but to say well done! Keep up the good work. I have learnt from your work that it is always good to follow the instructions so that you can learn more and excel.
Regards,
Ntokozo
This module is really good for people who just start want to learn about QGIS like me. The instruction is clear and easy to understand.
Hi all
I found this module very easy to follow. I had a play around and made my distribution layer see-through so the maps could be seen and renamed my layers. No problems so far.
Hi Kathryn
I like your map. What are the two colours of gibbon sighting points signifying? and how did you achieve this? it looks like a cool thing to be able to do.
Cheers,
Maddy
this really helped me in navigating the software as im still quite new into this. really happy when the map pop outs cause i never expect it would be that user friendly to people like me… heheh if theres anything to improve please do comment down below!
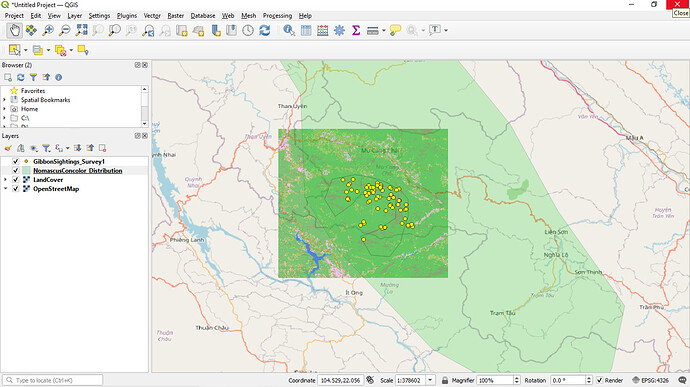
hi! i think its really cool that you made the area a little transparent which made it available to see layers that are underneath! cool trick to learn!
Very easy so far, which is encouraging. I remember GIS being quite difficult with all the different terms used. So the links to the glossary of terms will definitely be Bookmarked. Module 1 was clear, easy to follow instructions. I didn’t struggle at all. Yet…. Very interesting to see how much information can be stored in each data point for the sightings of the Gibbons. That could be useful for my own data, to know that you can access that in the project.
Thankfully I am finding this course to be less difficult than I expected and have not encountered any major problems yet. The step by step instructions are very clear and easy to follow.
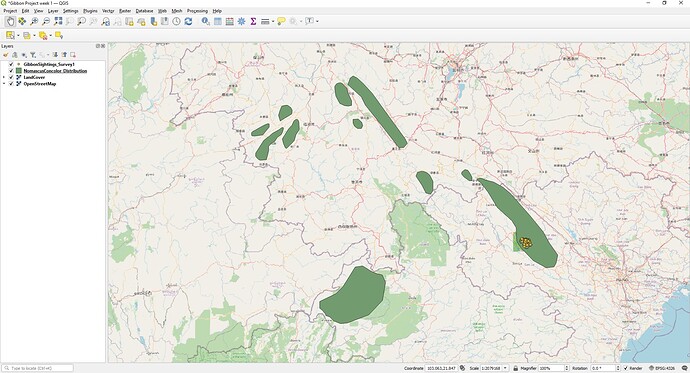
I really like how your distribution layer is transparent, it makes it much easier to see all of the data together. I have adopted this concept and used it in my case study also, thank you! My only suggestion could be that you could be zoomed in closer to the gibbon sightings, but other than that I think it looks great.
