Great job, so happy to see that mine is similar to yours! Looks like we’re getting somewhere 
Hi,
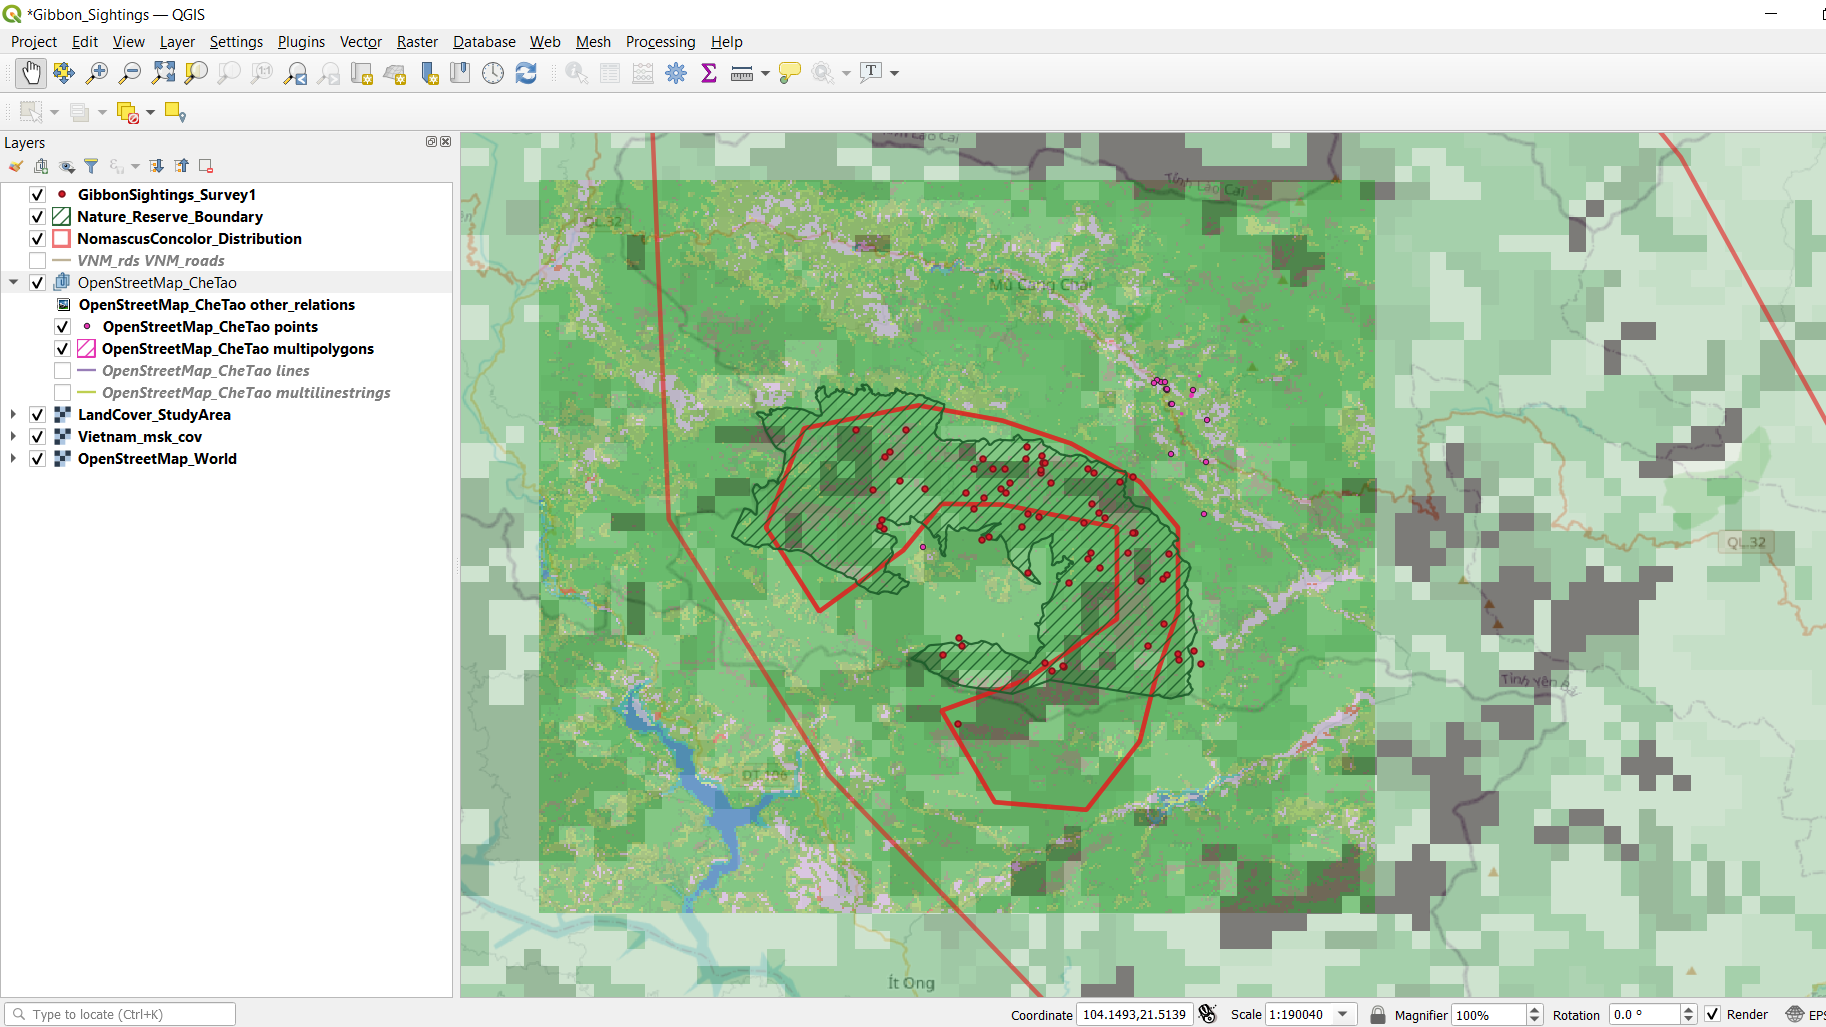
Here is mine, Module 1 instructions was clear and easy to follow. I already started to try using Q_Gis before, and I have learned new things here about how easy it is to import OSM into Q_Gis project.
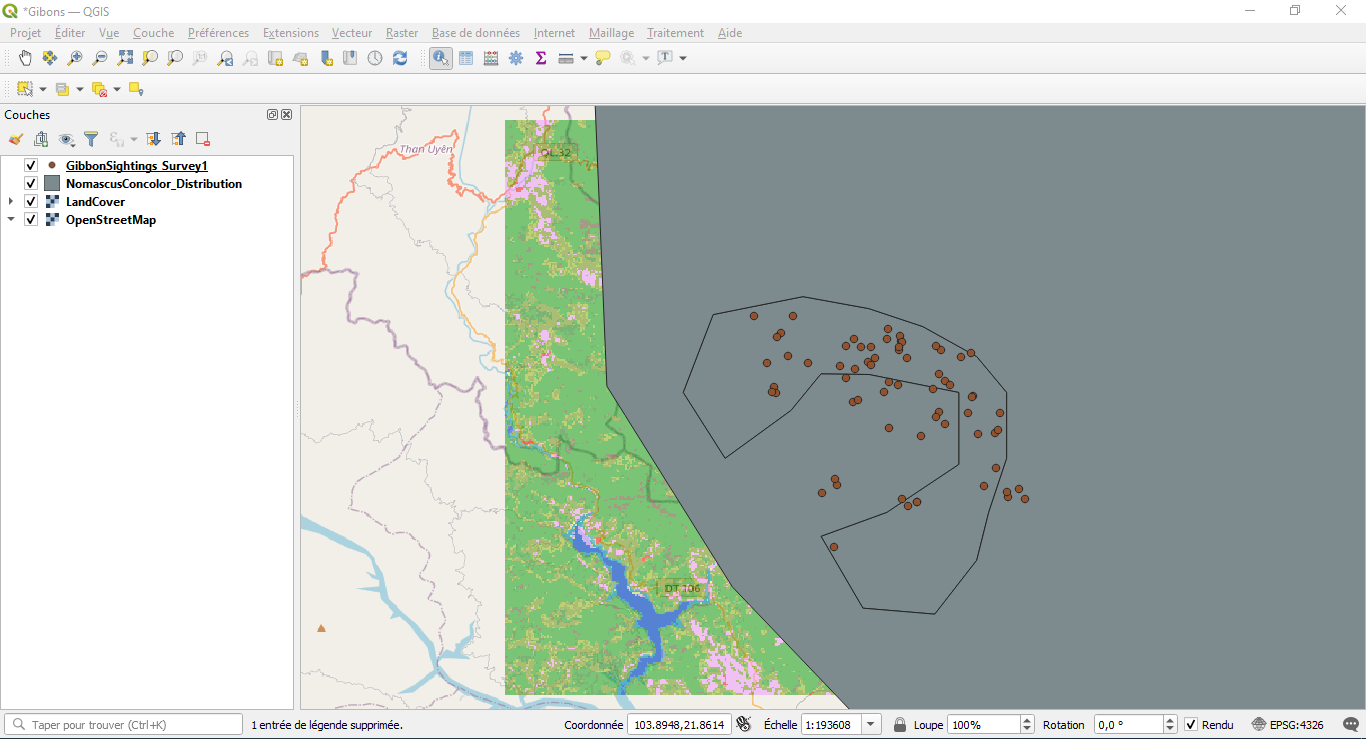
Thank you for the tips on changing colour. Gave it a try and it works.!
1 Like
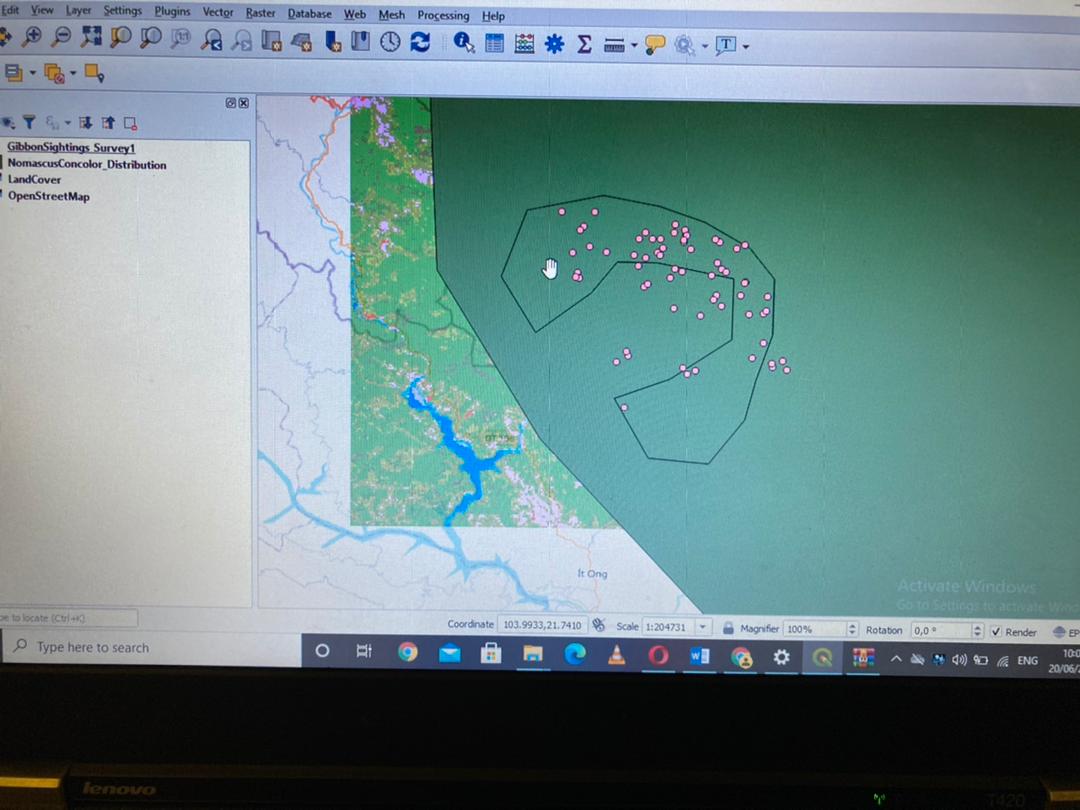
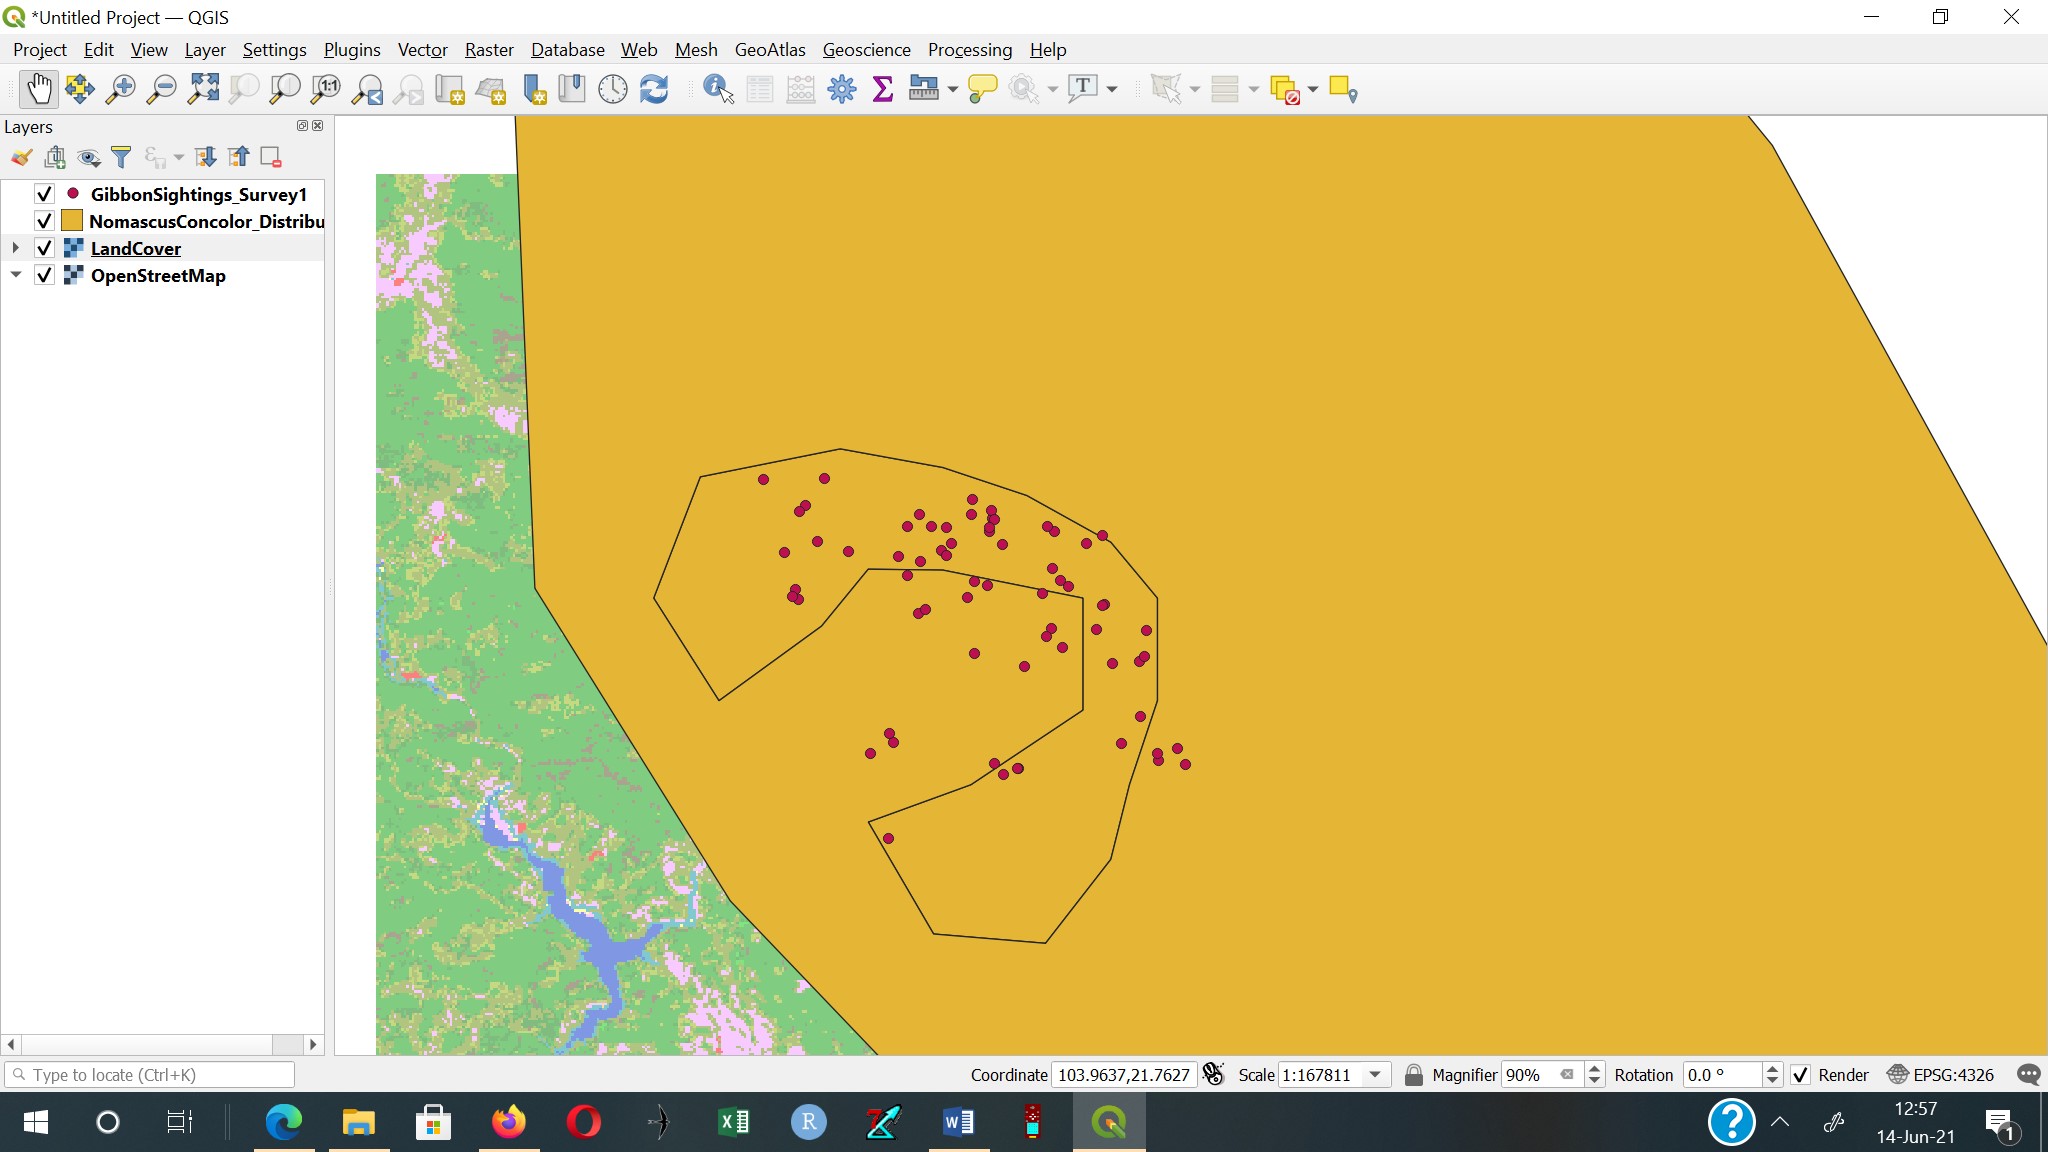
This module was very easy to read and understand although for some reason after adding the ‘Land Cover’ layer this stopped my other layers showing even after rearranging them to be on top. I fixed this by just removing those layers and re-adding them. This has helped me to understand how layers work and can be manipulated for the work I will be doing using GPS tracks
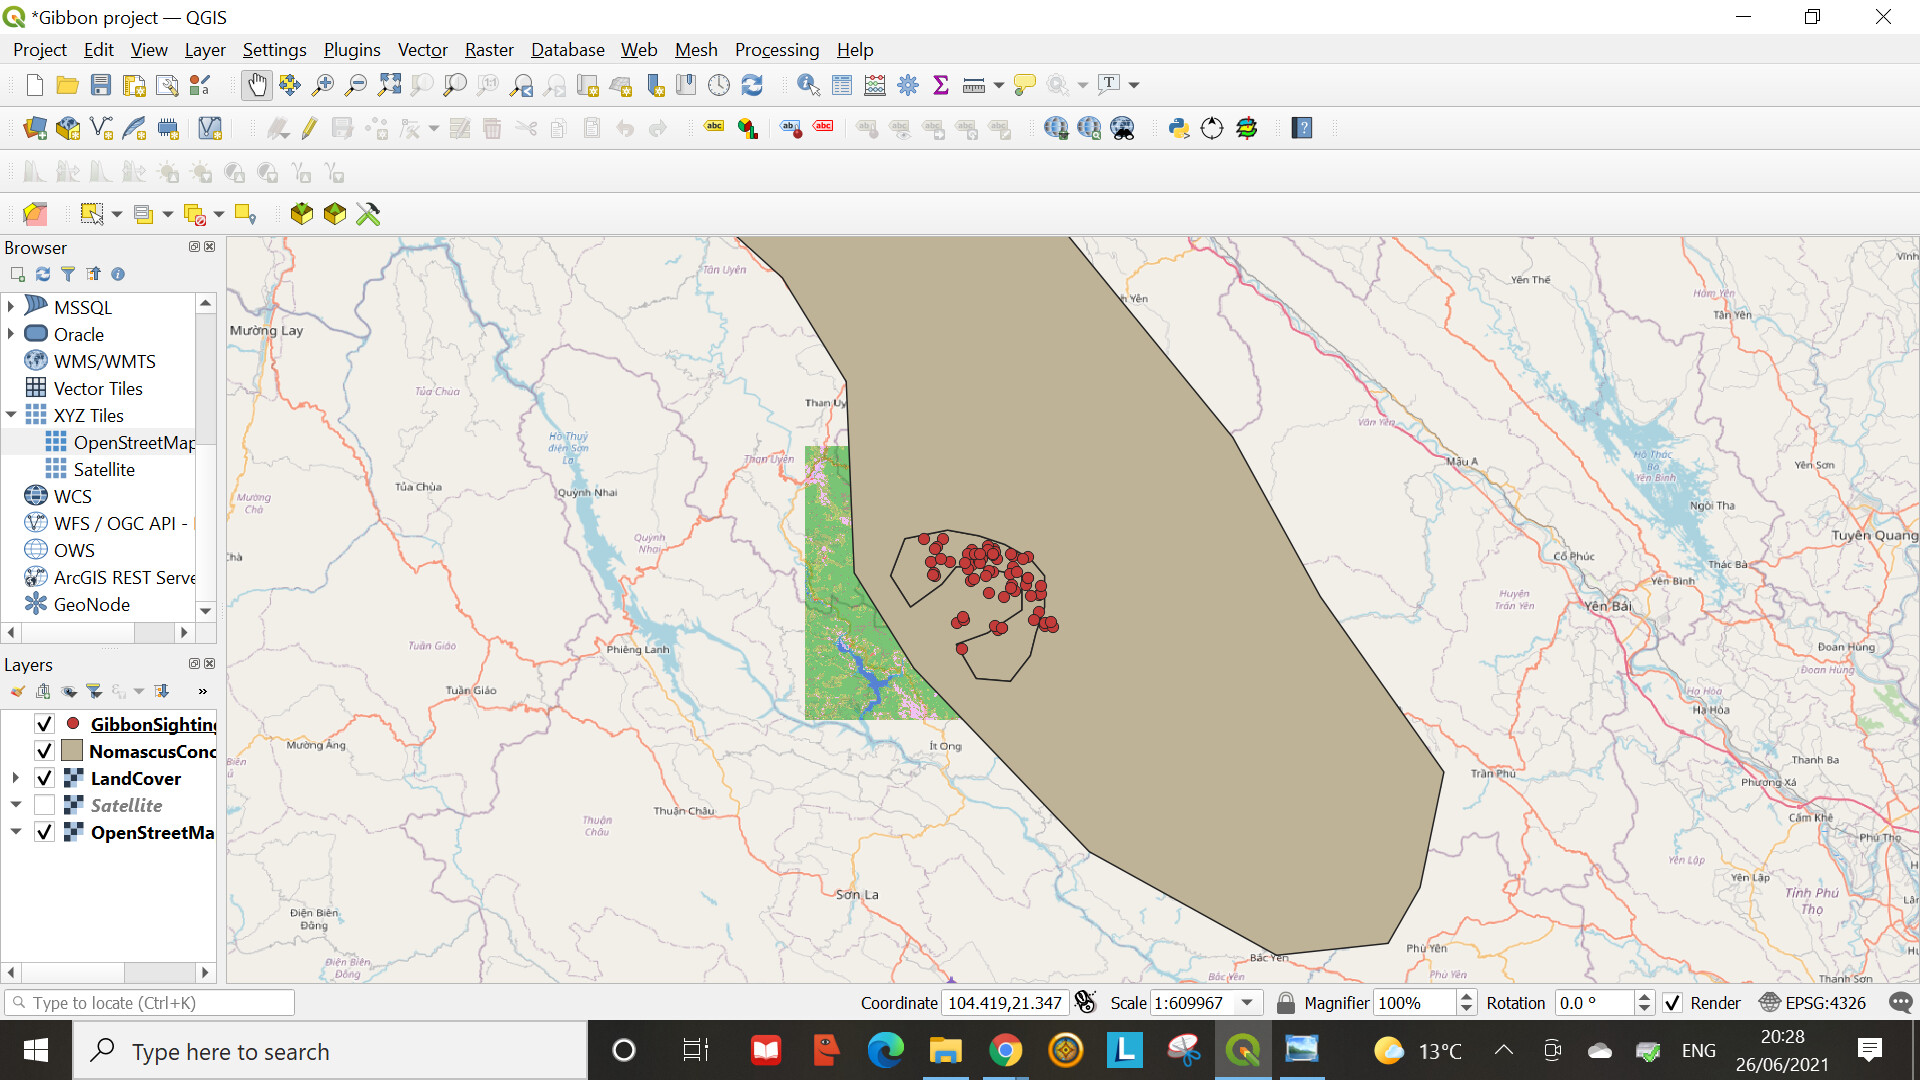
This module has helped me to familiarise myself with the basic components of GiS, how to use the navigation tools and how the layers work. I have used Arc GiS in my MSc but that was a few years ago and I had forgotten the basics. This module is a gentle intro which helps me to learn, instead of getting overwhelmed with too much information.
I like your map, changing the settings so you can make polygons transparent to the base map really helps see what is going on across different layers. I think that is the fun thing about GIS, you can play around with it and make your research visually interesting and easier to understand.
Hi Sumedha,
Your map gave me two great insights!
-
we can change the opacity of a layer to not completely block layers below it.
-
we can start annotating right away.
I don’t really have a suggestion for improvement on this module, but I will start experimenting with opacity and annotation right away! Thanks!
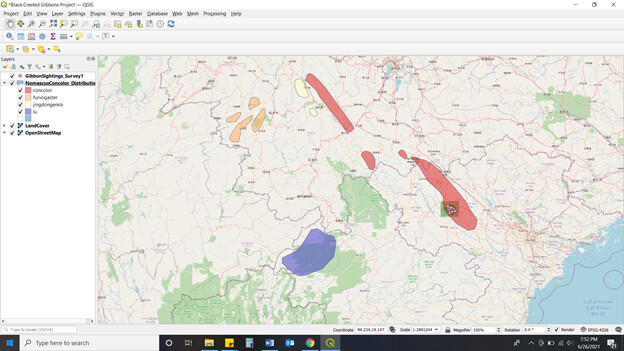
I found that this module was very easy to follow along with and achieve the desired result as displayed in the module directions. I saw JonathanGatward’s project and decided to go back into the layers to see if I could figure out how to change the opacity of the distribution layer and the color by subspecies. I was successful! I did this by right clicking the distribution layer and selecting properties. Under the Layer Properties pop up I changed “Single Symbol” To “Categorized”, for value selected SUBSPECIES, and added a spectral color ramp. Then I clicked “Classify” which brings up each subspecies with a color. You can right click on each layer to change the color/opacity.
I found this link helpful when trying to figure this out: data - Displaying different attributes within layer with individual colors in QGIS 3? - Geographic Information Systems Stack Exchange
Thank you for posting this! As a beginner, I didn’t know you could do this! I went back into my project to see how this was accomplished and I was able to figure it out! If anyone else is wondering I posted the steps I followed on my assignment post. Or go to the following link. I used the answer by MapHound.
I think you are right that it didn’t really make sense to have the solid polygon above the land cover as you could no longer see it, but I’m assuming that as we progress there is a reason why that order was recommended. I was able to change the opacity of the distribution layers on my project by right clicking on the distribution layer and changing to 50% opacity. I think that solves the problem for now as it now makes sense for that data to be displayed on the top of the map layer.
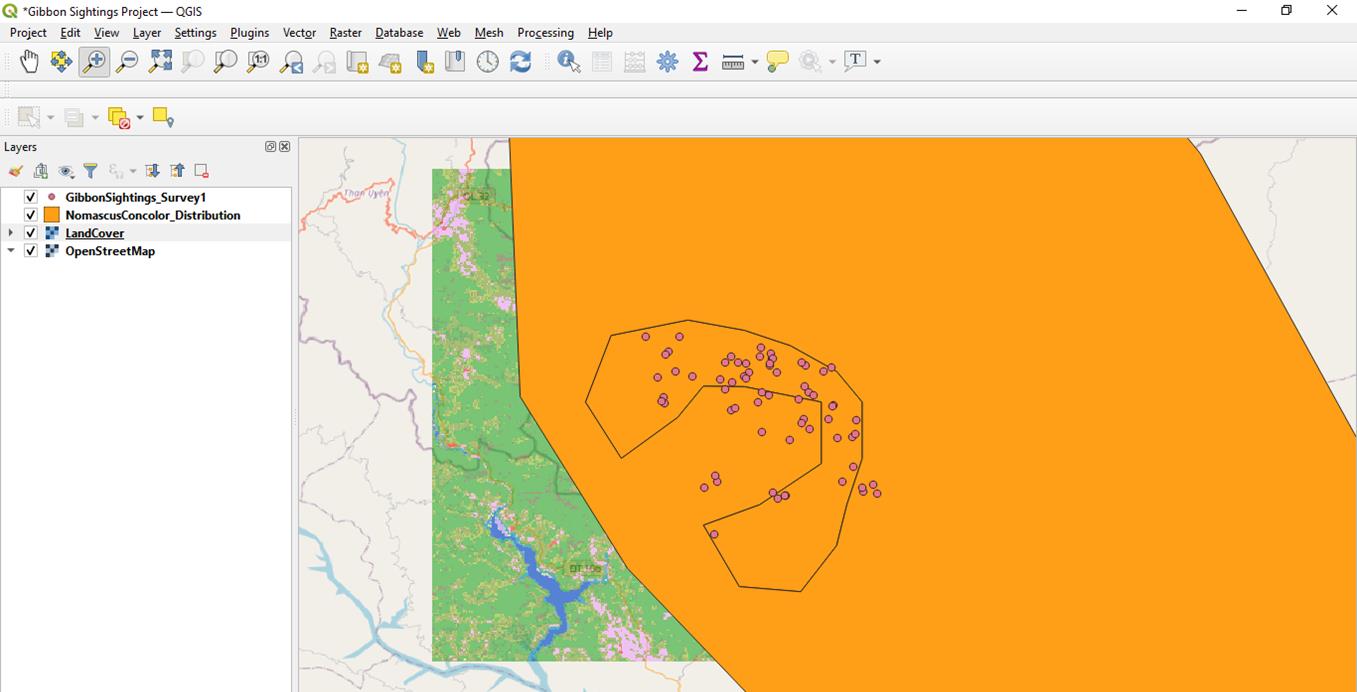
Hi everyone. I am doing some very late catch up on the module assignments, but I’m glad to be going through this wonderfully crafted course.
My learning goal is broad: to improve my understanding and application of GIS to be able to understand and interpret datasets produced by conservation organizations I work with so I can better convey the importance of this work to stakeholders.
The first module using gibbon data as a sample was well suited for me, as the datasets we work with are often species specific.
Hi Wisdom. I’m glad to read that you were able to resolve the challenges you came across with assistance from our peers. Thank you for sharing this experience. It is good to see an example of group support in action even this early in the course!
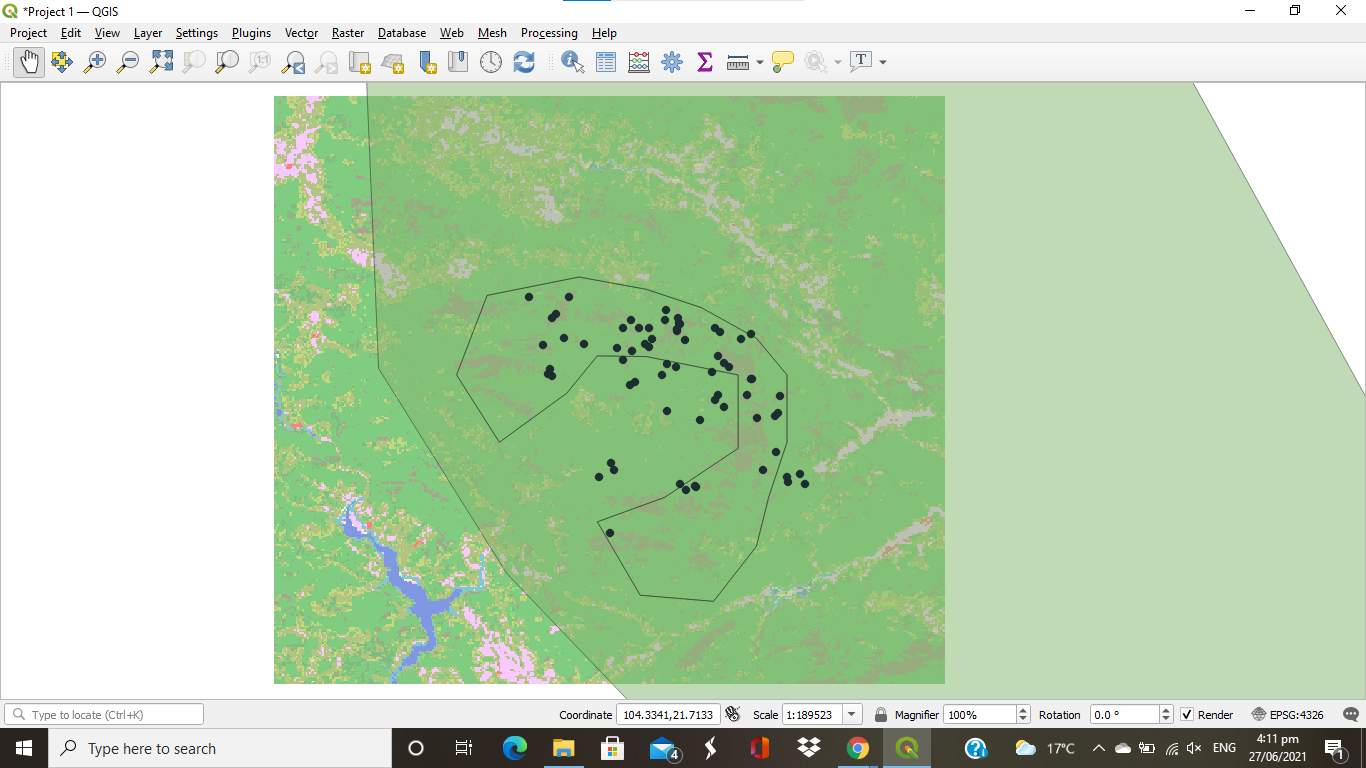
I found this a great introduction to GIS for someone who hasn’t tried it before. The instructions were easy to follow and I followed someone else’s advice to change the transparency on the layers. I’m looking forward to doing the next module (running a bit behind schedule).
Hi, great tip on changing the transparency. I found the slider bar worked well for me. Thanks.
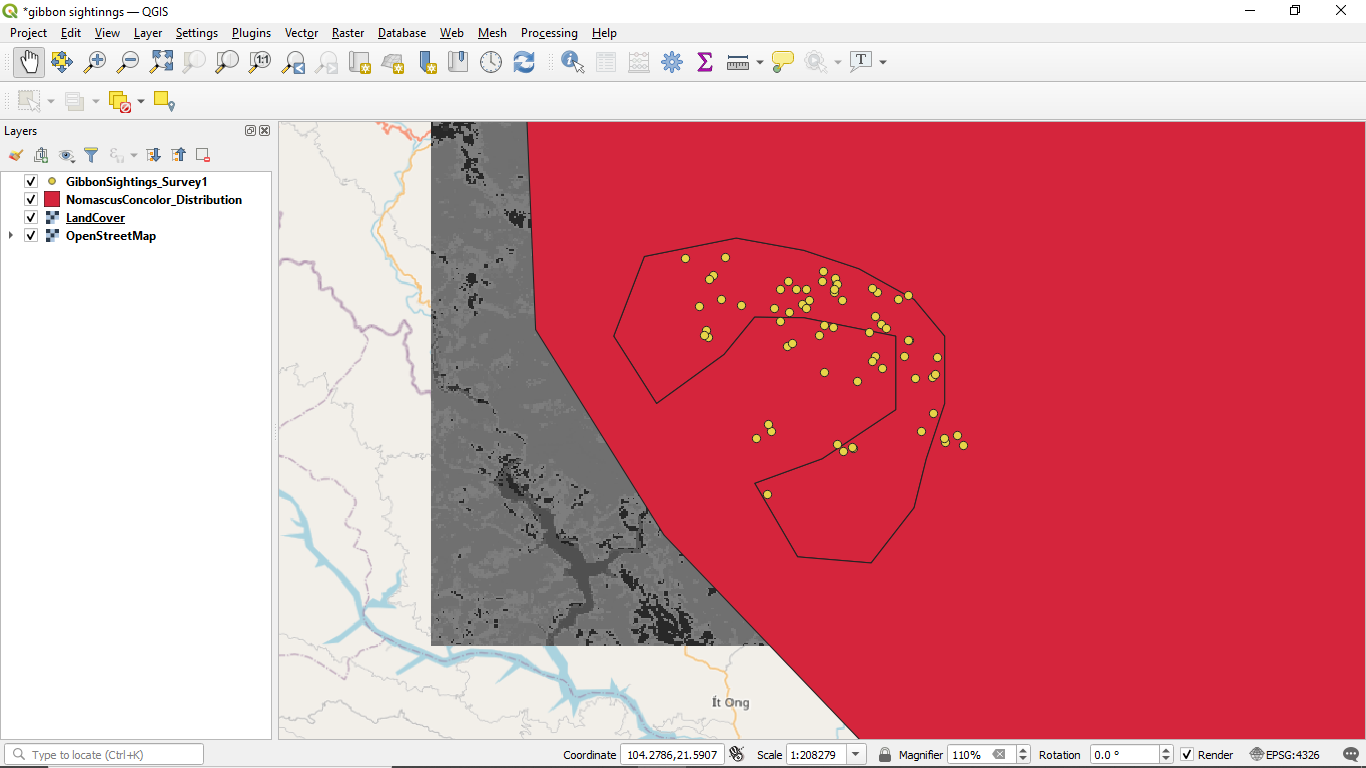
here is mine! love this class so much. I found this easy to follow. however, I don’t know how to change the LandCover colour. Mine is just black and white.
I’ve tried looking for how to improve. but I can’t find it.
waaw! great to see that.
I just realized that it can be transparent.
anyway, do you know how to change the LandCover colour? Mine is just black and white.
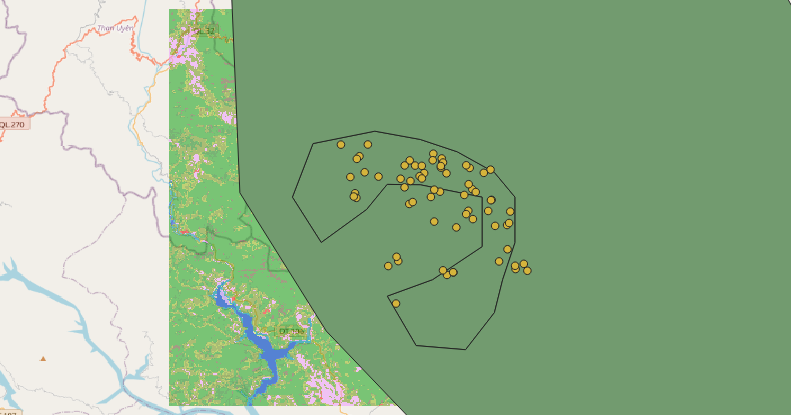
courage. your map really look good for me