This section was quite good. I am now understood what Latitude and longitude mains and how to represent them on a surface plane. One more thing benefit from this section is that I am now able to set the SRS of my layer, to reprojecting and merge layers.
I encountered two little problem during the practical section
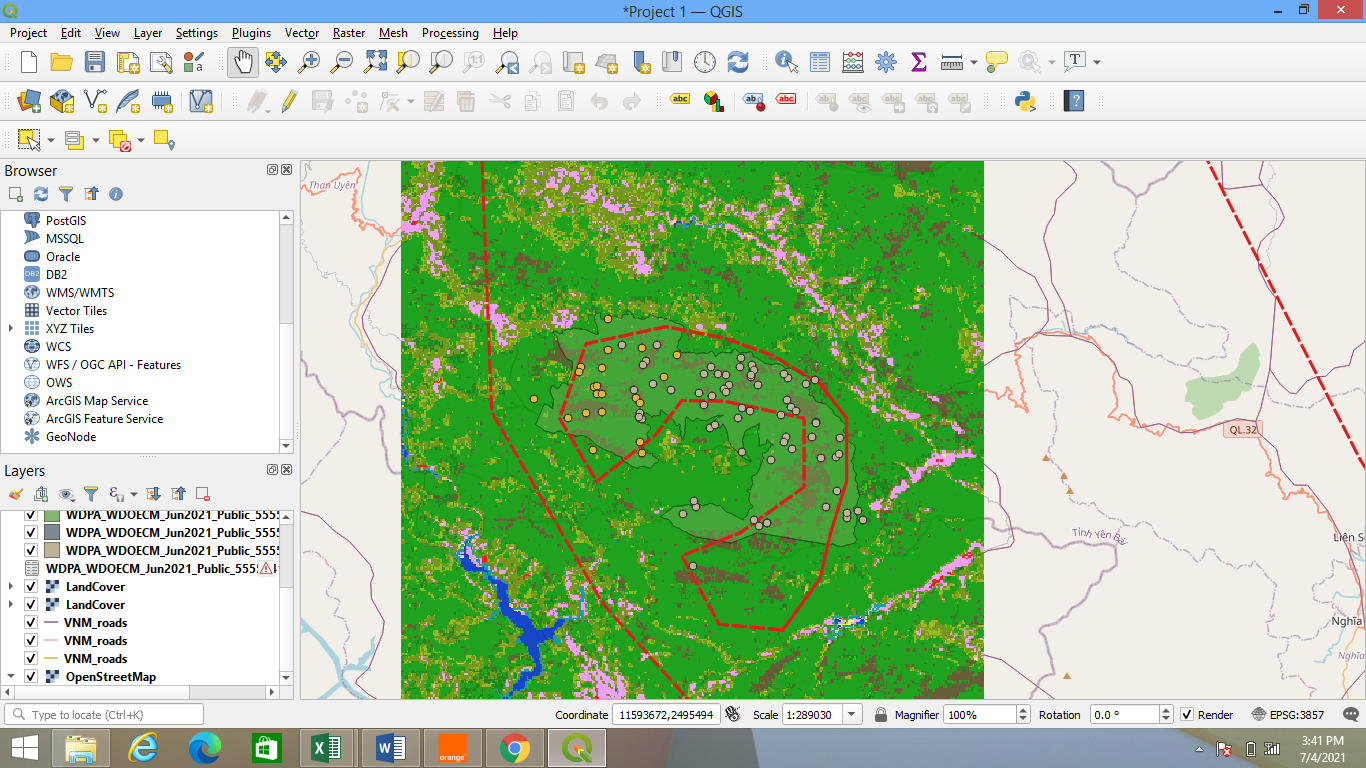
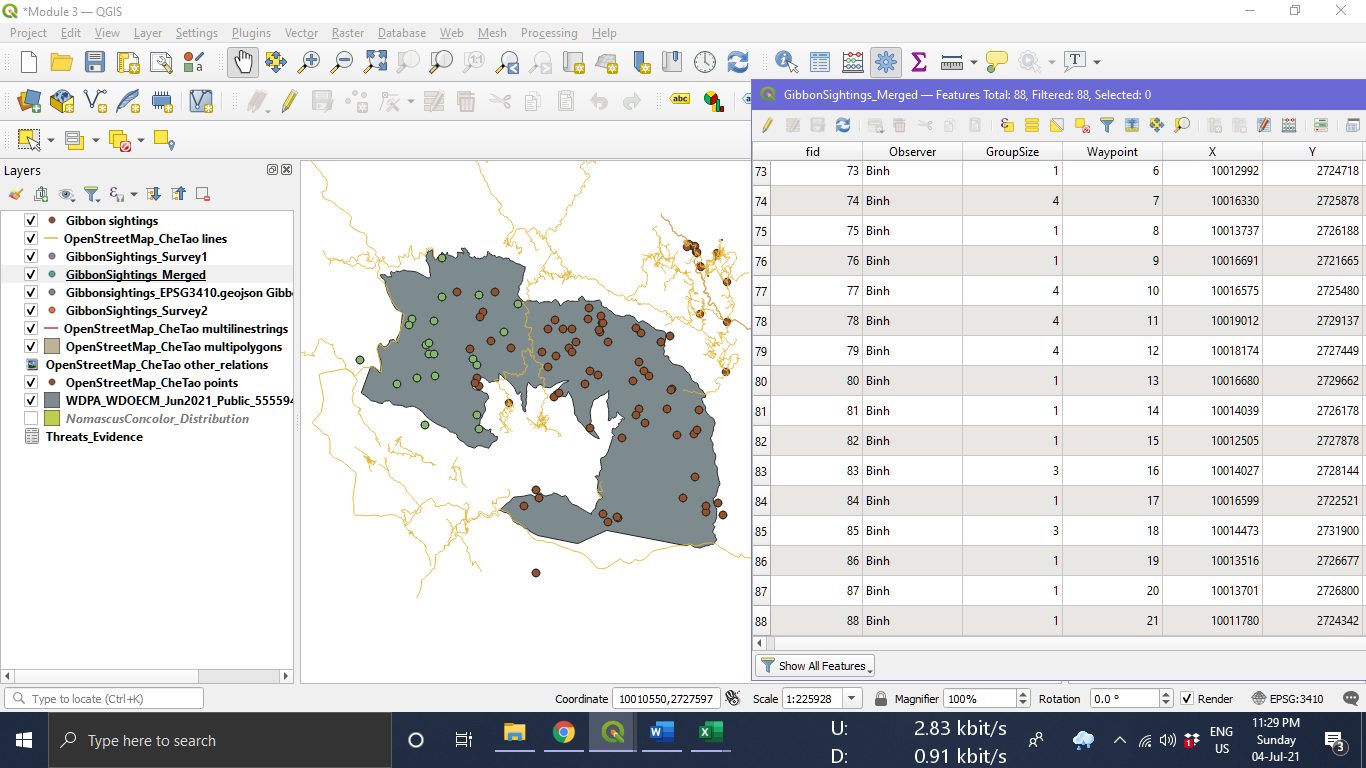
I had a little difficulty to add the GibeonSighting_Survey2 file because the in the Pop-up windows the DMS coordinate box was tick.
The ‘processing’ option was not showing on my tool bars. To solve the problem I saved my project and closed it. When I re-opened it again it was there
Learned about different CRS, the importance of SRS and adding layers from spreadsheet all were explained well with examples also Coordinates of CRS and Projected locations and different between them…
This lesson was bite challenging and interesting. I started to enjoy it when it comes to reprojecting of data that is in a different format. Initially I got lost when try to reproject data and I was looking for GibbonSightings2 layer in the layer panel, it was not there and I did panic a bite. I decided to go back and I found that I missed a step, I did not download the data and add the layer. I eventually resolved the problem and completed the exercise.
This week I learned how to upload an excel file as a delimited layer, which will come in handy for field data I believe. Also learnt about latitude, longitude and how there are different projections or datum. And its important to be aware of which CRS you are using before collecting your data and inputting it to QGIS.
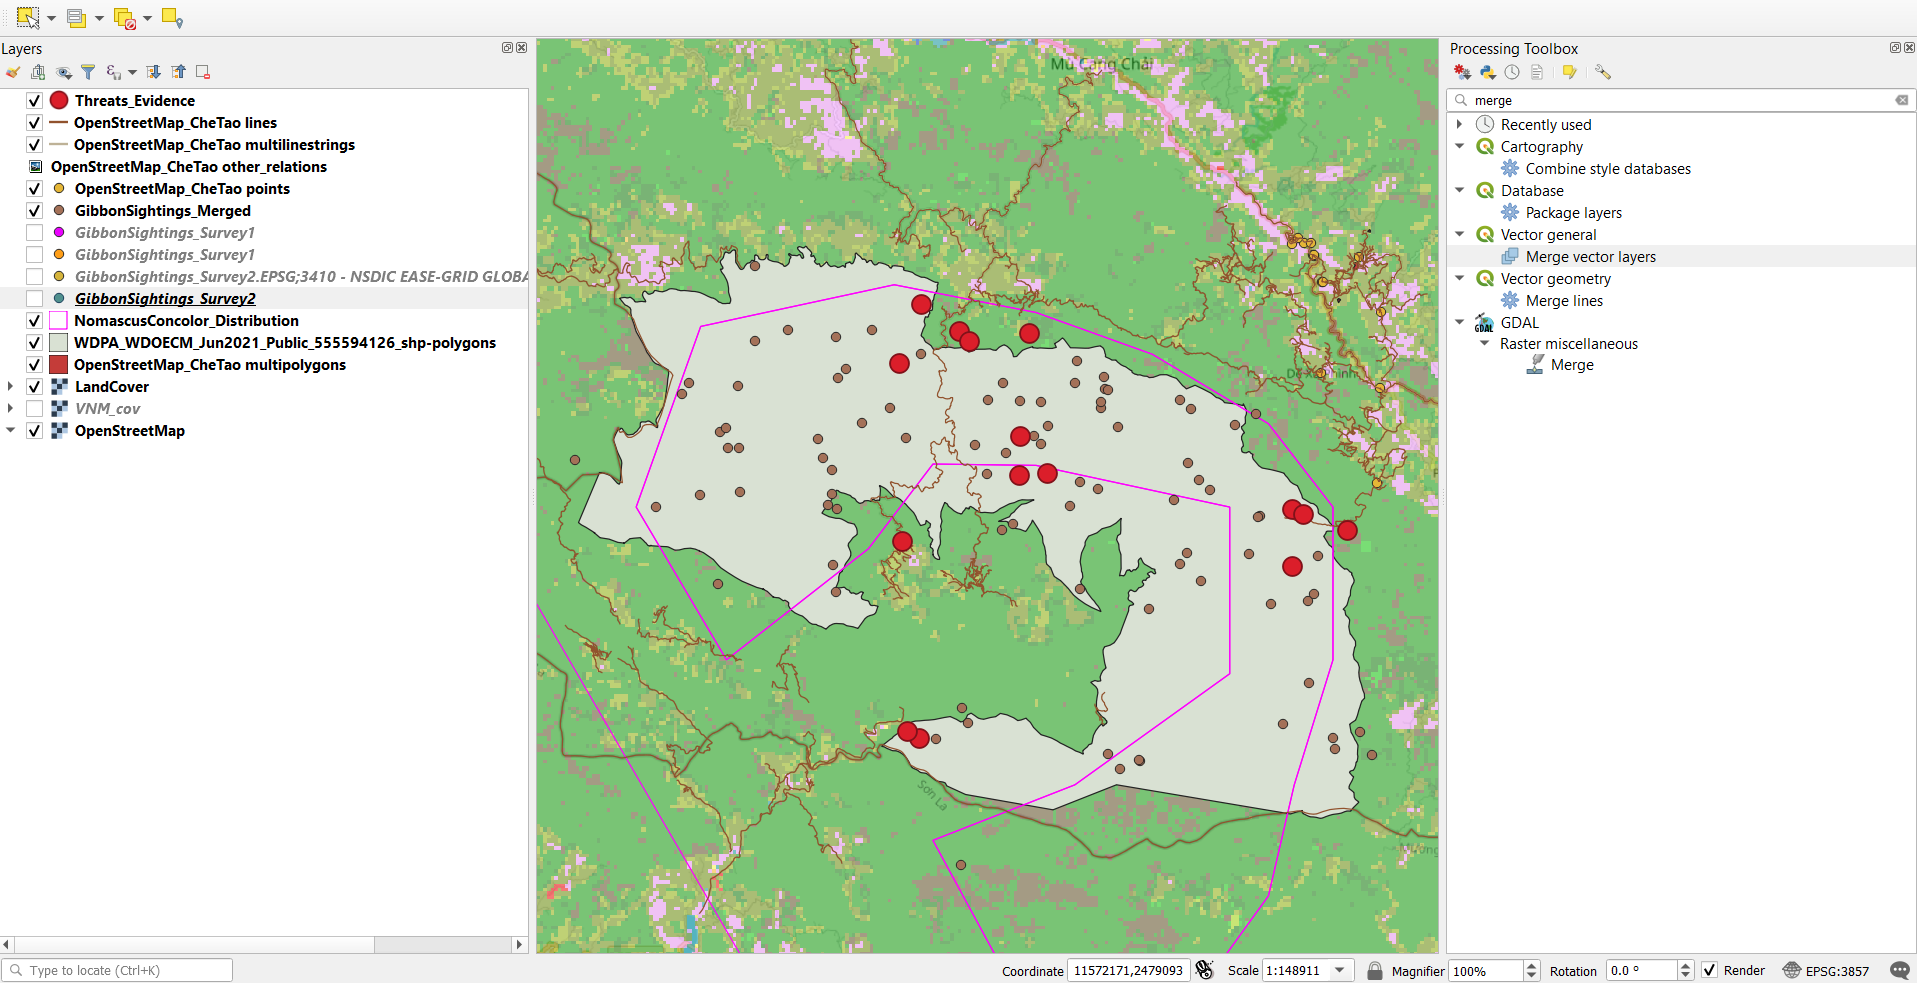
Also learnt how to reproject data and merge with the toolbox which was very interesting.
Not too many problems encountered this time round. The screenshots were definitely helpful anytime I was confused or unsure.
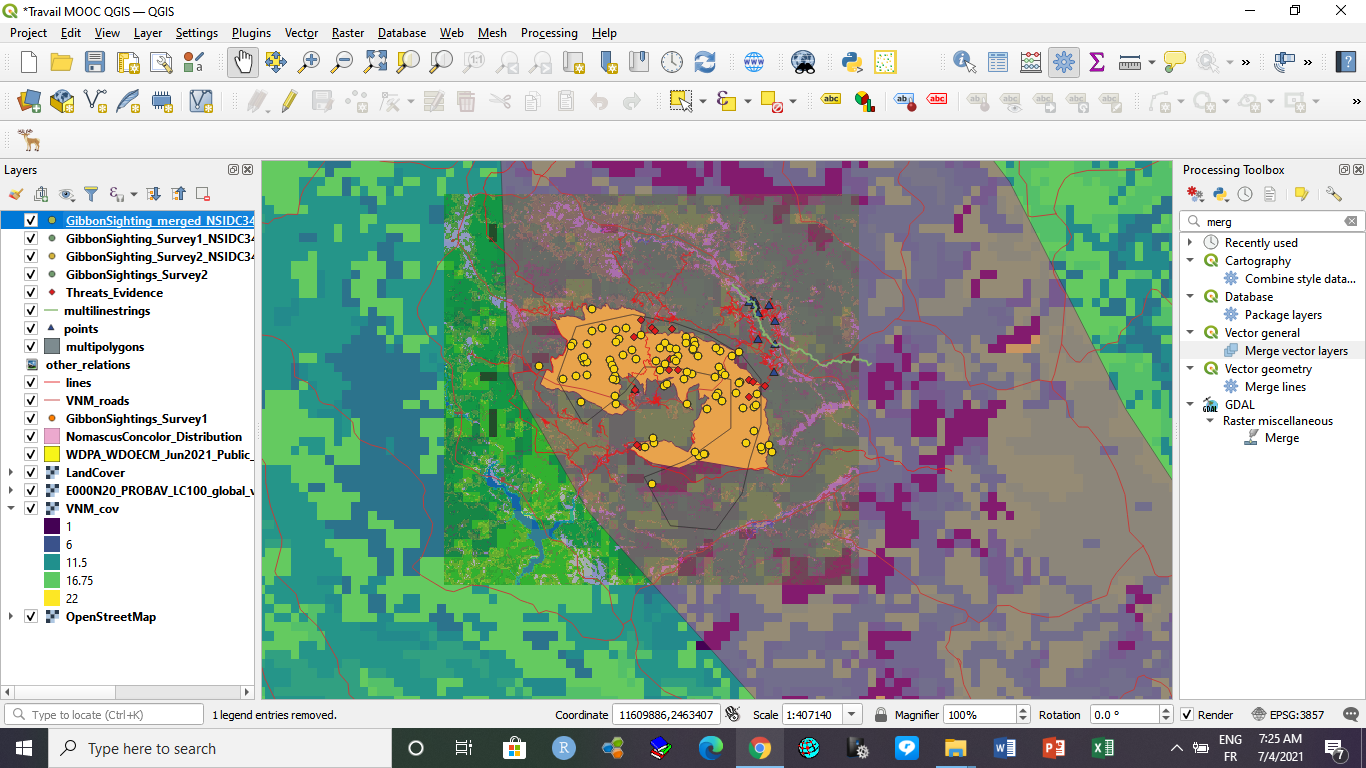
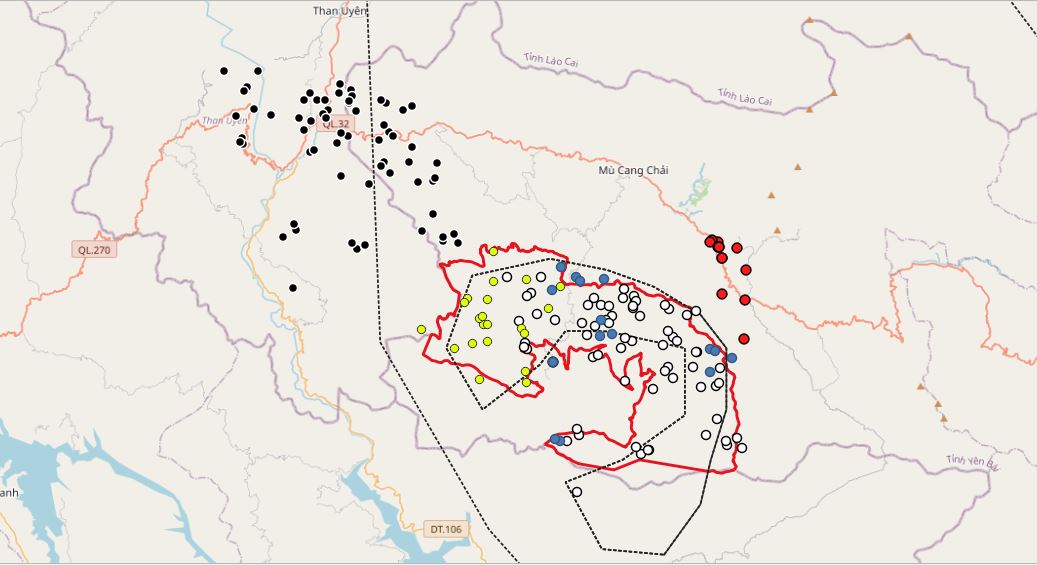
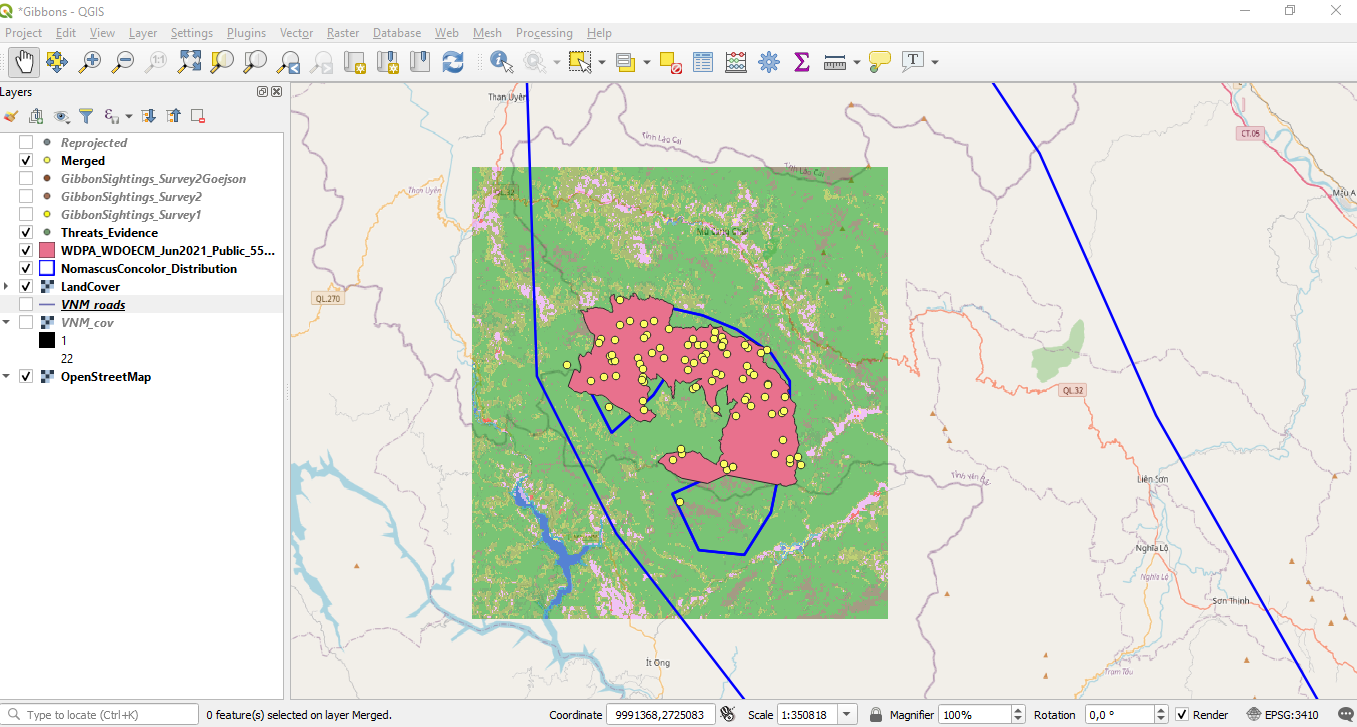
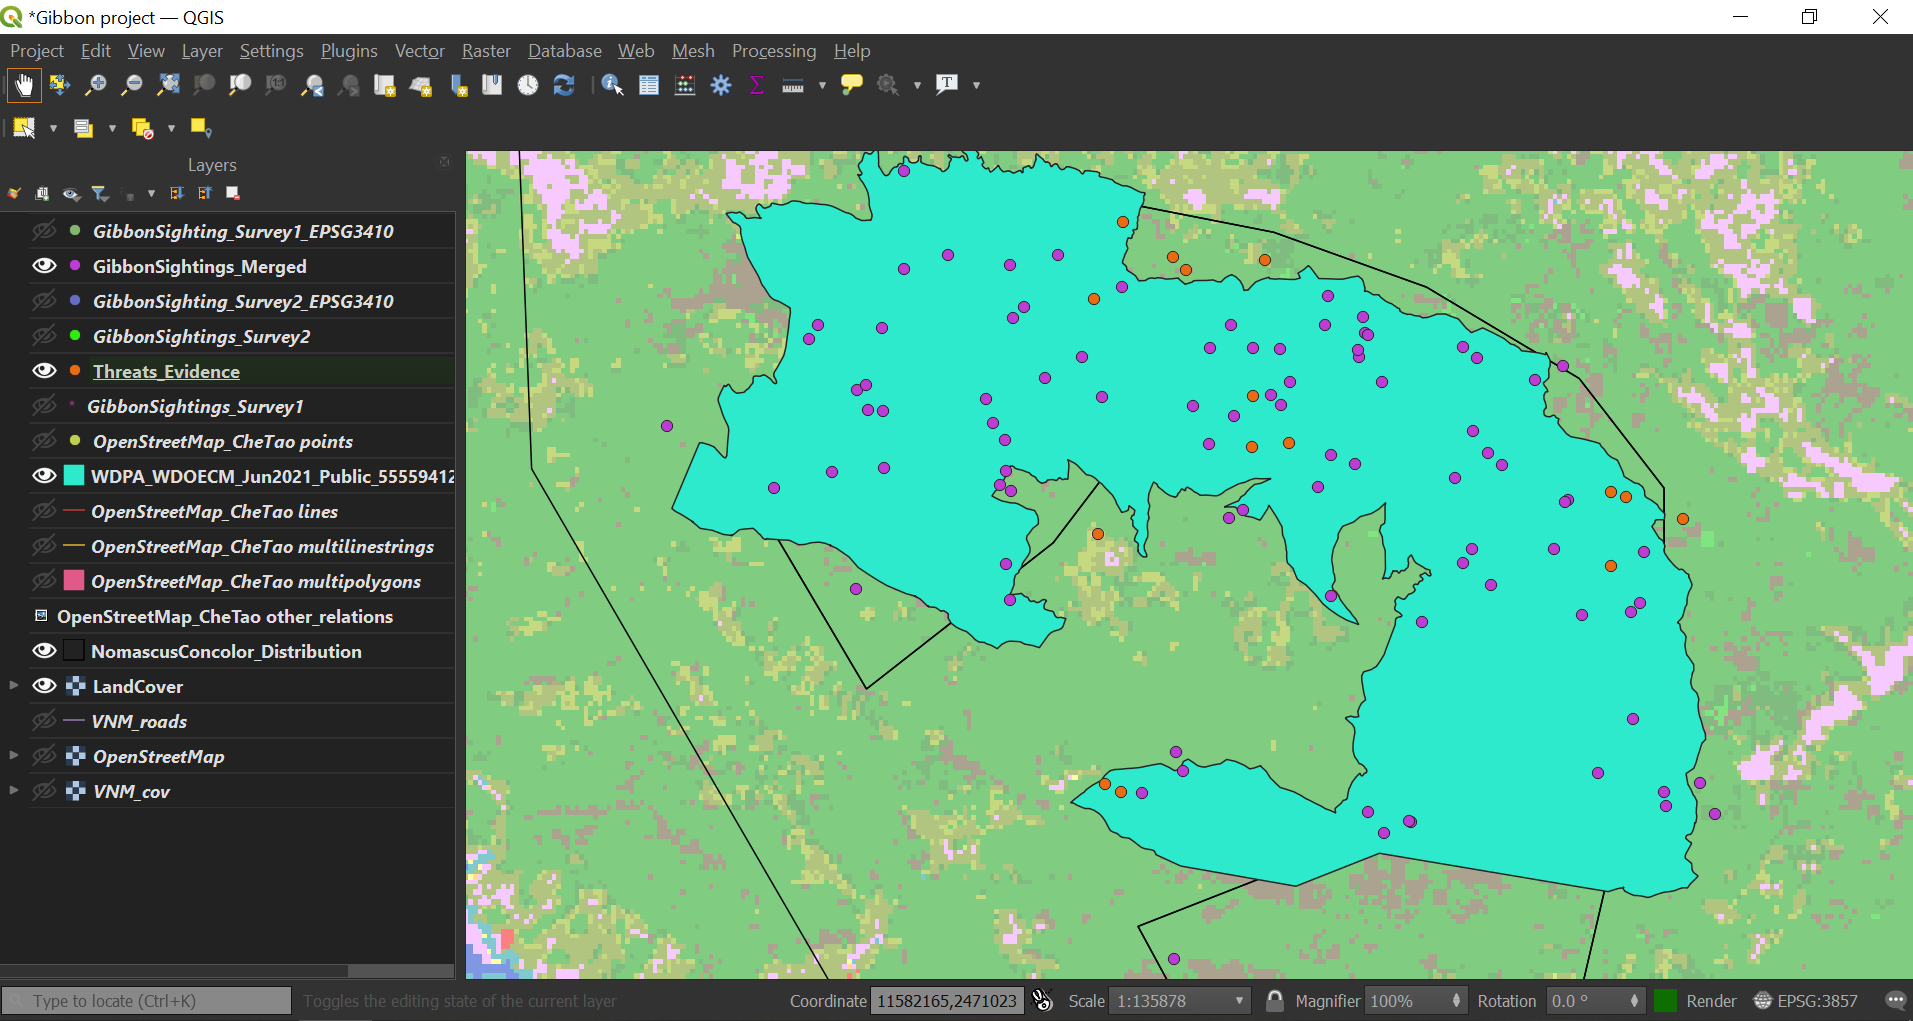
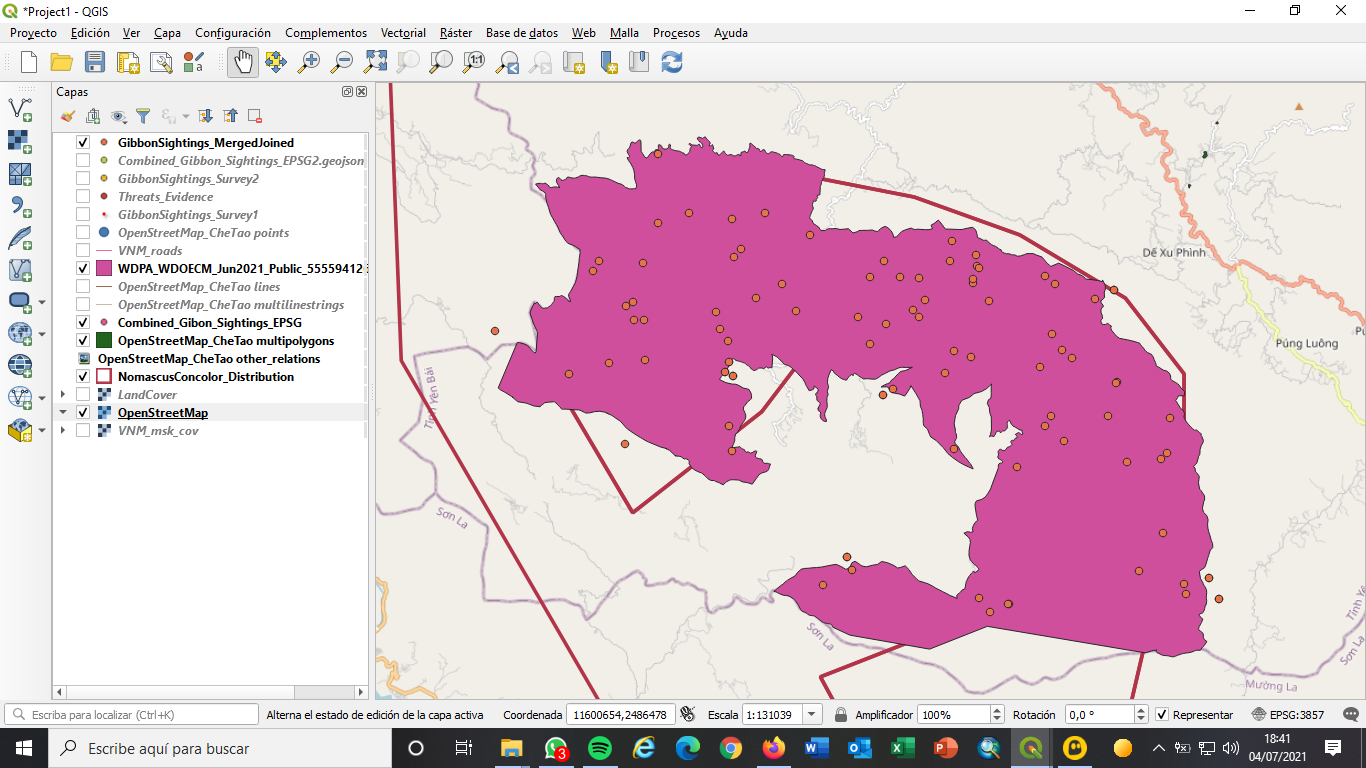
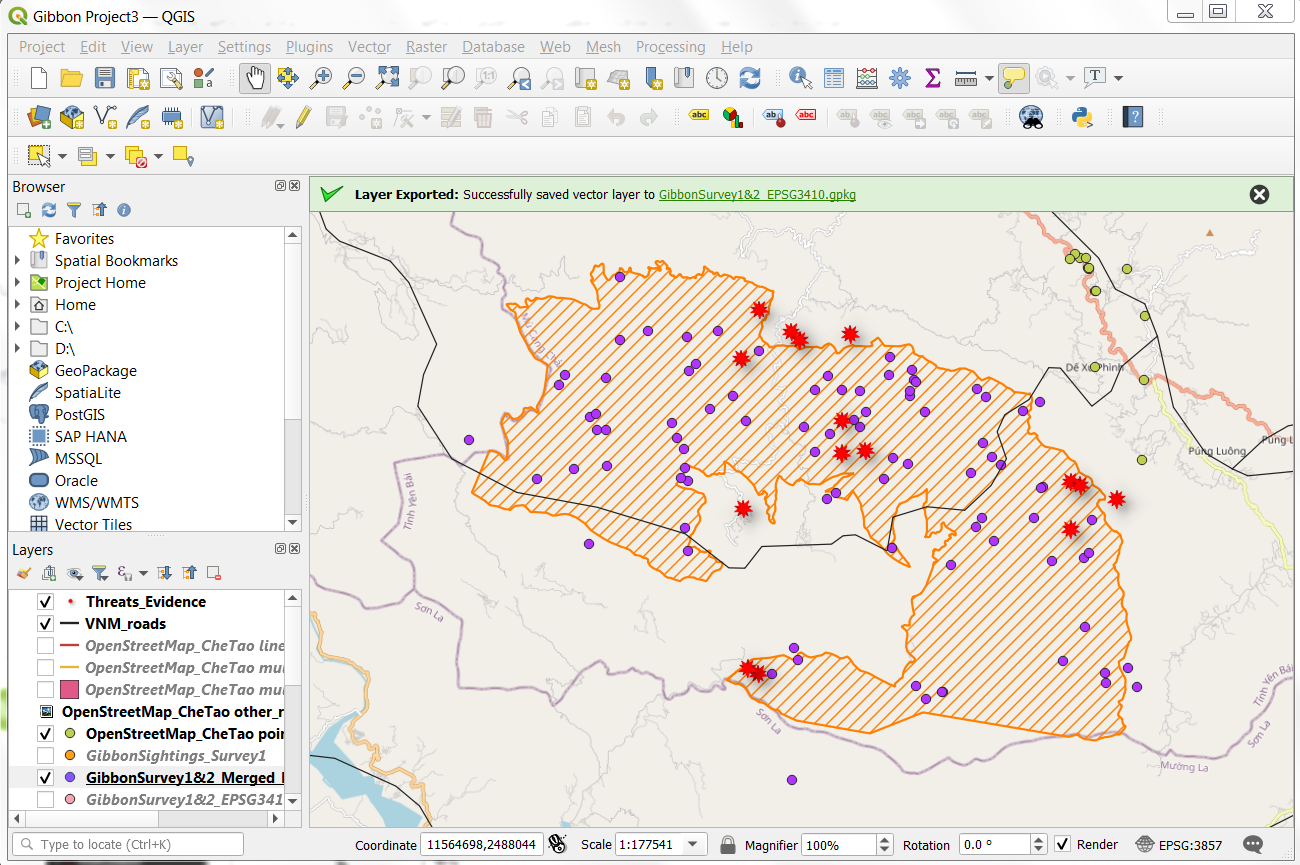
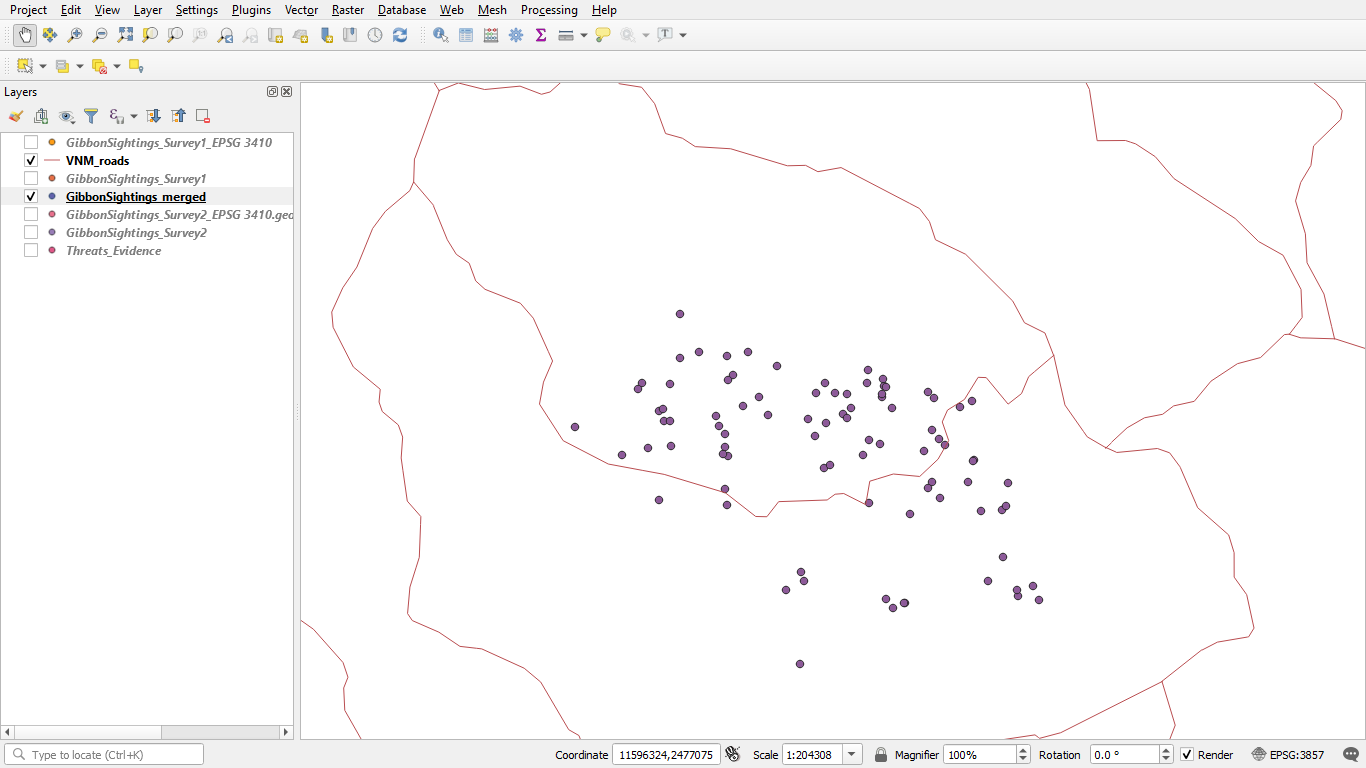
I’ve chosen just to display the merged data, threats and distribution layers in my screenshot. This week was great, learnt lots! Looking forward to next week
This was one of the more complicated assignments so far having encountered a few errors along the way which were then quickly resolved with a little bit on tinkering.
I’ve learned so many things this week. Learned about latitude and longitude. Have known of different between CRS and SRS, importing them from excel file, type of geospatial data to use for different datasets and merging the sperate files into one.
Hi,
You have done a wonderful work.
I am wondering that why we have to save the file with .geojson? Is it because of points Vector layers? WGS84 is for CRS?
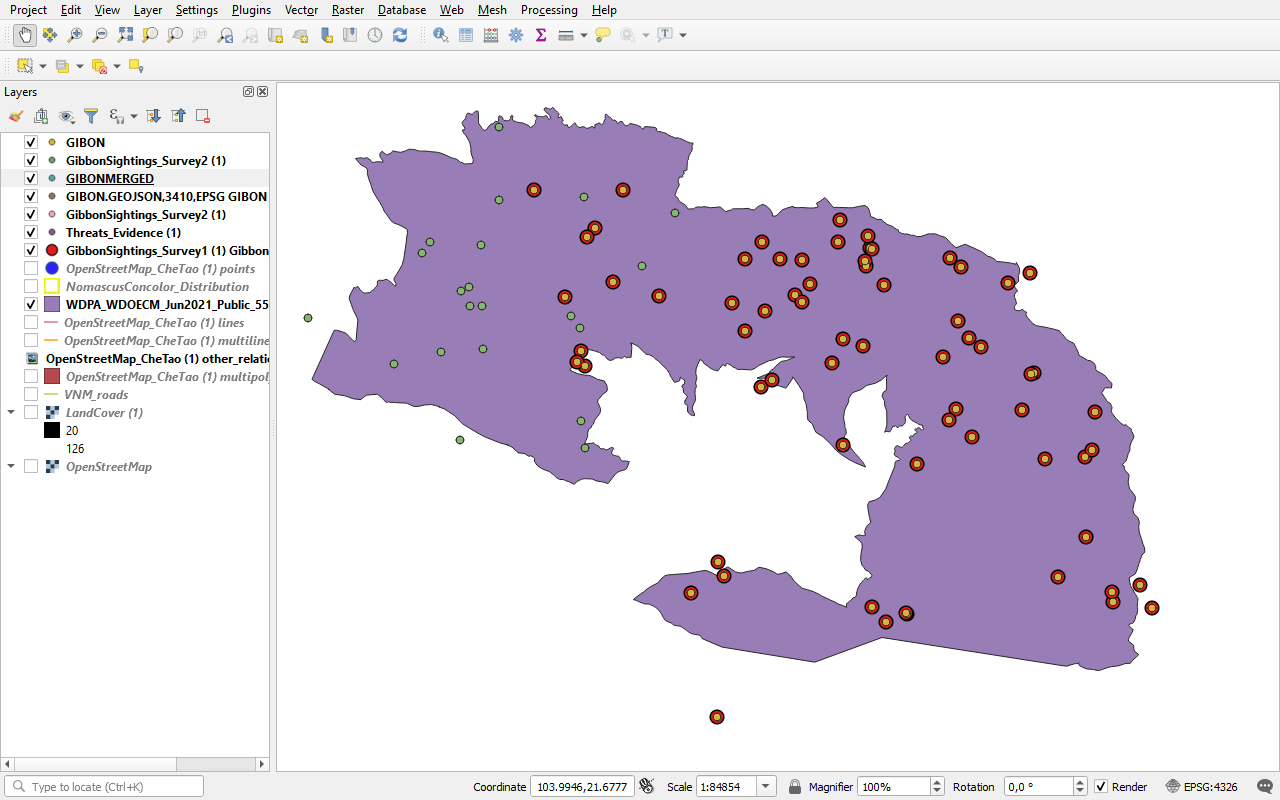
Hi, well done on your assignment! I like how you have visualised your data, it makes it very interesting to look at. How did you get the gradient effect for the Chế Tạo Nature Reserve boundary?
I progressed more by far In this module3 than the other 2: Because I was a bit confused with the subject of projections, data, or SRS: now I have it much clearer, to know the different map projections that there are and the diversity of the application of these in projects yes, depending on what each project sends you.
I have not had great problems when it comes to the project, perhaps a little when it comes to reading the theory and understanding the definitions, but rereading and looking for information on the web I have understood everything much better.
-I really like your work, I think all the points can be correct and well done, congratulations.
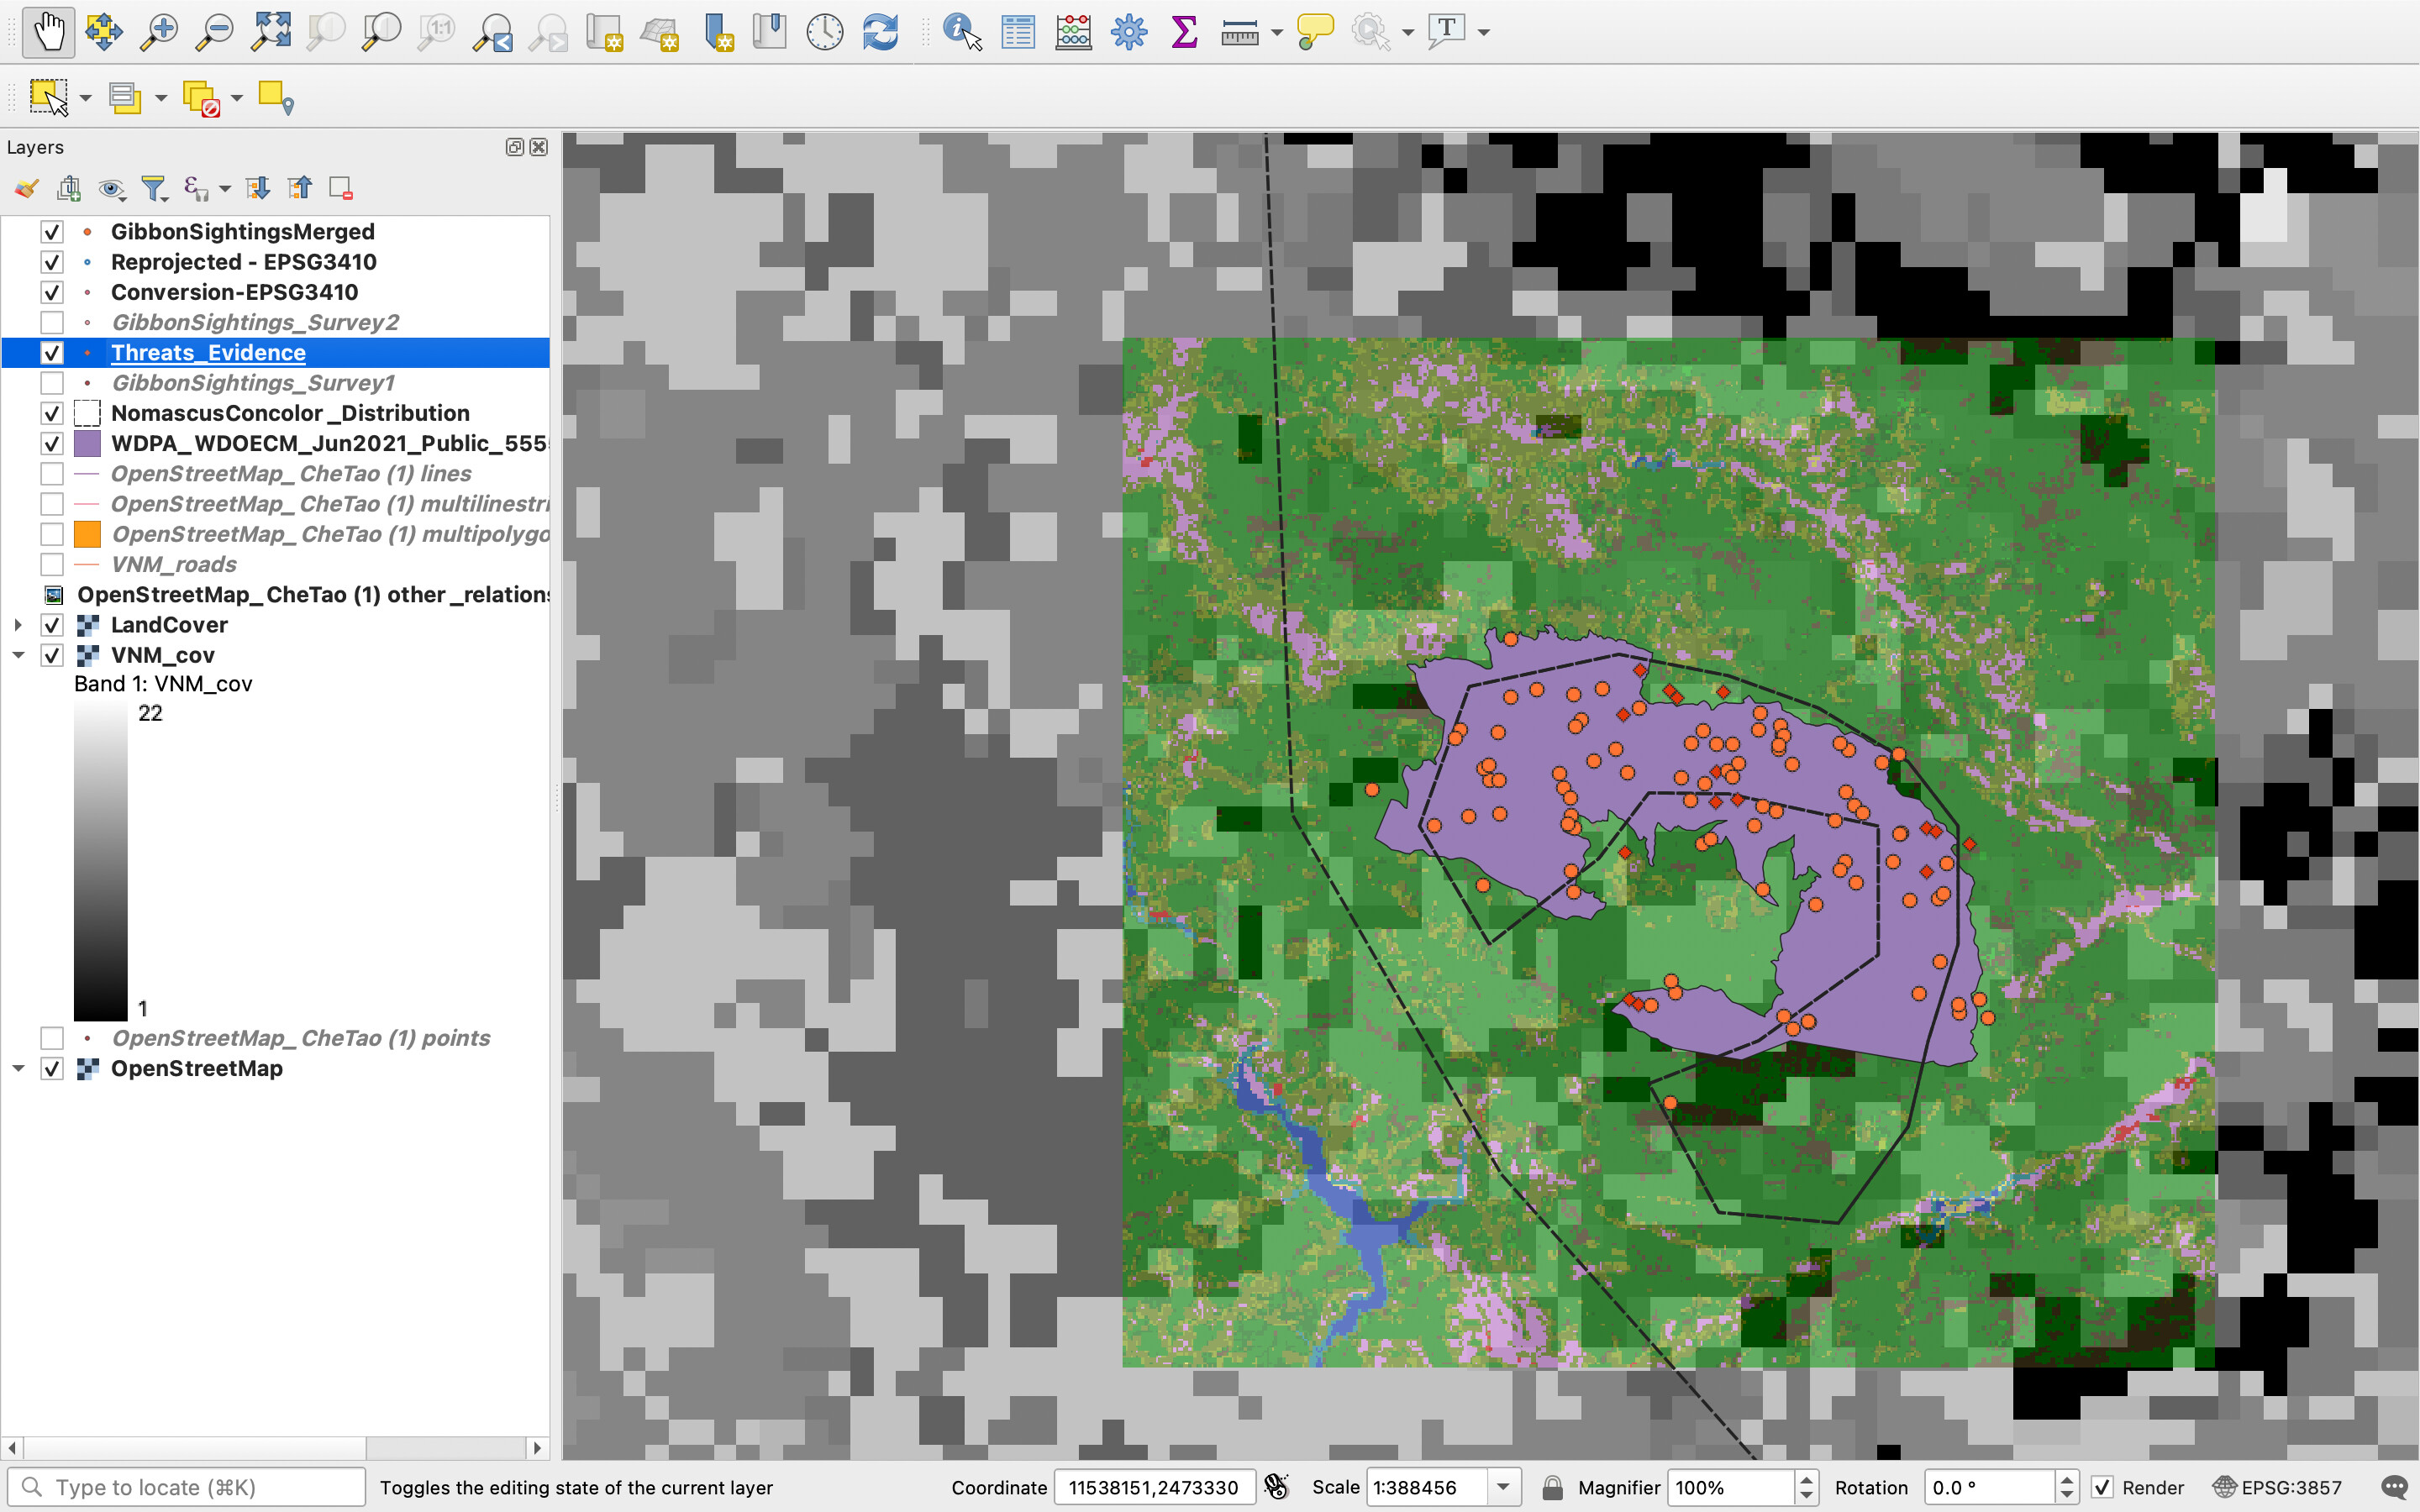
-Love your dark Qgis interface, maybe I could also apply it to my work. Also activate the LandCover layers because this way the perspective is better to compare the map and the sightings.
-As a suggestion to improve your work, perhaps you could visualize the attribute table of the joined sightings in the screenshot to confirm that it has been correctly corrected! (88 points)
This was the most challenging exercise so far. I am more clear now about the difference between a geographic coordinate system and a projected coordinate system and how to re-project data but with such a large number of different CRS’s I think I will need more experience to gain confidence that I am using the most appropriate one for my work. I am using WGS 84 with Lat. & Long. data from a GPS but will need to calculate distance and area on the ground but I’m still not sure which projected coordinate system I should convert my data to. Any thoughts?
Hi Sumbede,
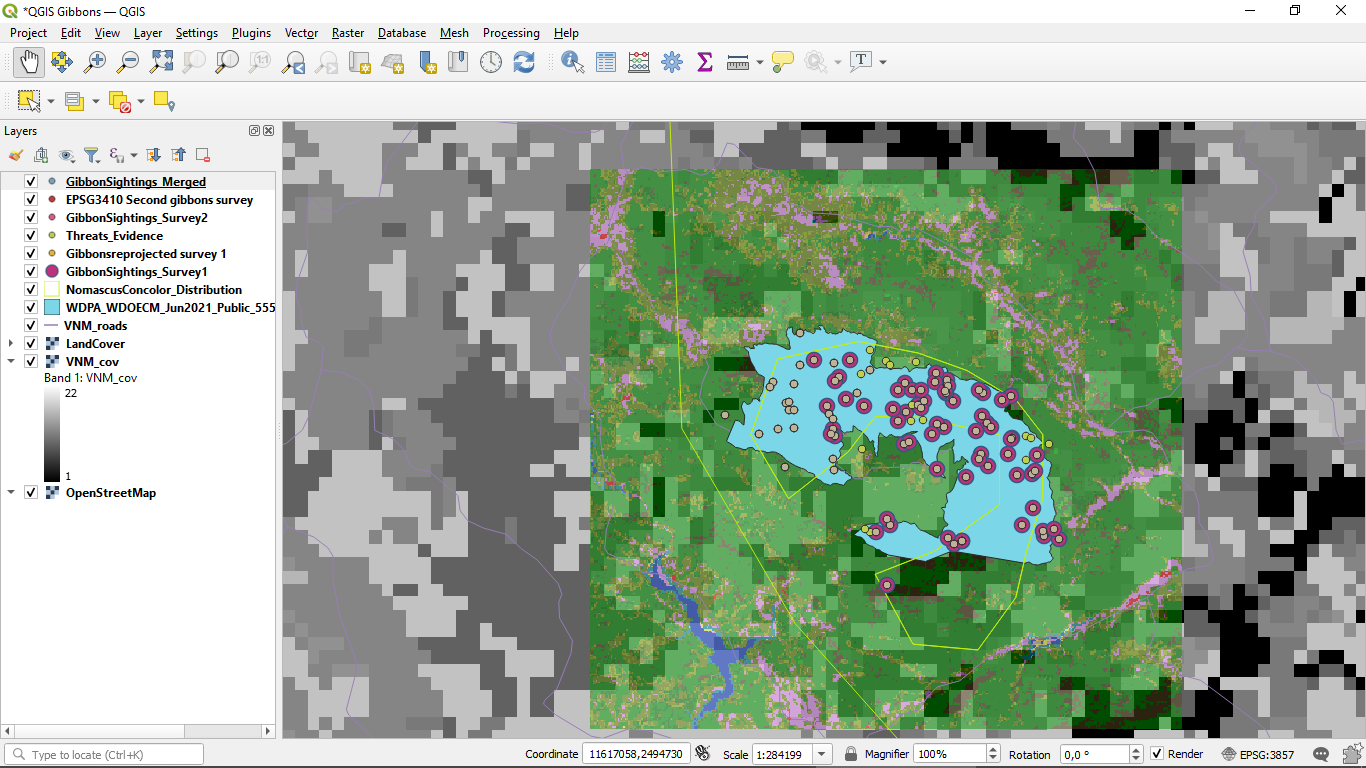
I like the scale and colour system you have chosen for your map. The data points really stand out.
If you just want to show the ‘useful’ layers, you could try unchecking the layer for VNM_cov and also Nomascus Concolour Distribution. Both these layers are very course grain and in my view do not add a useful level of detail.
Cheers,
Greg
Here is the problem I have, or maybe it is not a problem but a confusion: when I imported Threat Evidence, it did not appear on the screen, not until I fixed the CRS into EPSG 3395.
However, when the instructions asked me to type WGS pseudo, two options appeared WGS 84/Pseudo-Mercator EPSG 3857 and WGS 84/Pseudo-Mercator EPSG6871. So, mine was changed from EPSG 3395 to EPSG 3857. I don’t know why my layer was not automatically 4326.
But this module was very interesting because the Reprojecting and Merging are very important tools to know. I think the reason why I was stuck when I tried with my data was because my layers did not have the same CRS and I could have used this “Reprojecting” to set the CRS of all of them the same and then all the layers would appear on the map.