Wow, I like your map, it looks really good
I unfortunately was not able to get it right to merge survey 1 and 2. I only got 42 values instead of 88 and I am not sure where things went wrong. I would need to go back and reread the instructions. I did however learn the concepts of CRS and SRS which is valuable.
nice looking map! I am sure that these concepts come slightly easier to you can apply them to your own project. I on the other hand don’t have a project of my own currently running, therefore I struggled with this module and was not able to merge my values to get to 88.
Reflection: I was able to apply all learning objectives but found it challenging to wrap my head around the SRS. I am sure that I will be able to do so when I go over the concepts again. This was a fun module and looking forward to the next one.
Very beautiful map I especially like the inclusion of only the most important layers and the hillshade cant wait to do the same using my own data.
Very neat map thanks for helping us realise that hiding other layers makes it look more clearer and beautiful.
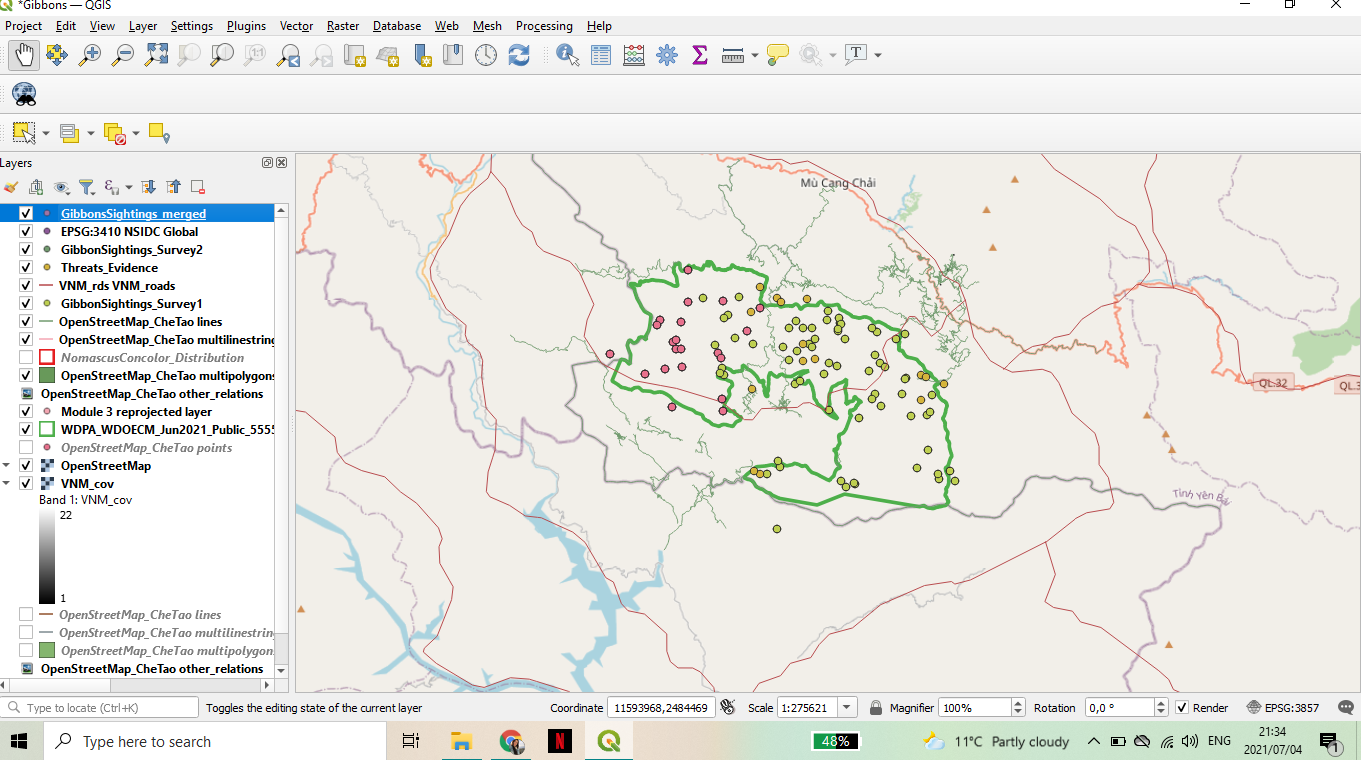
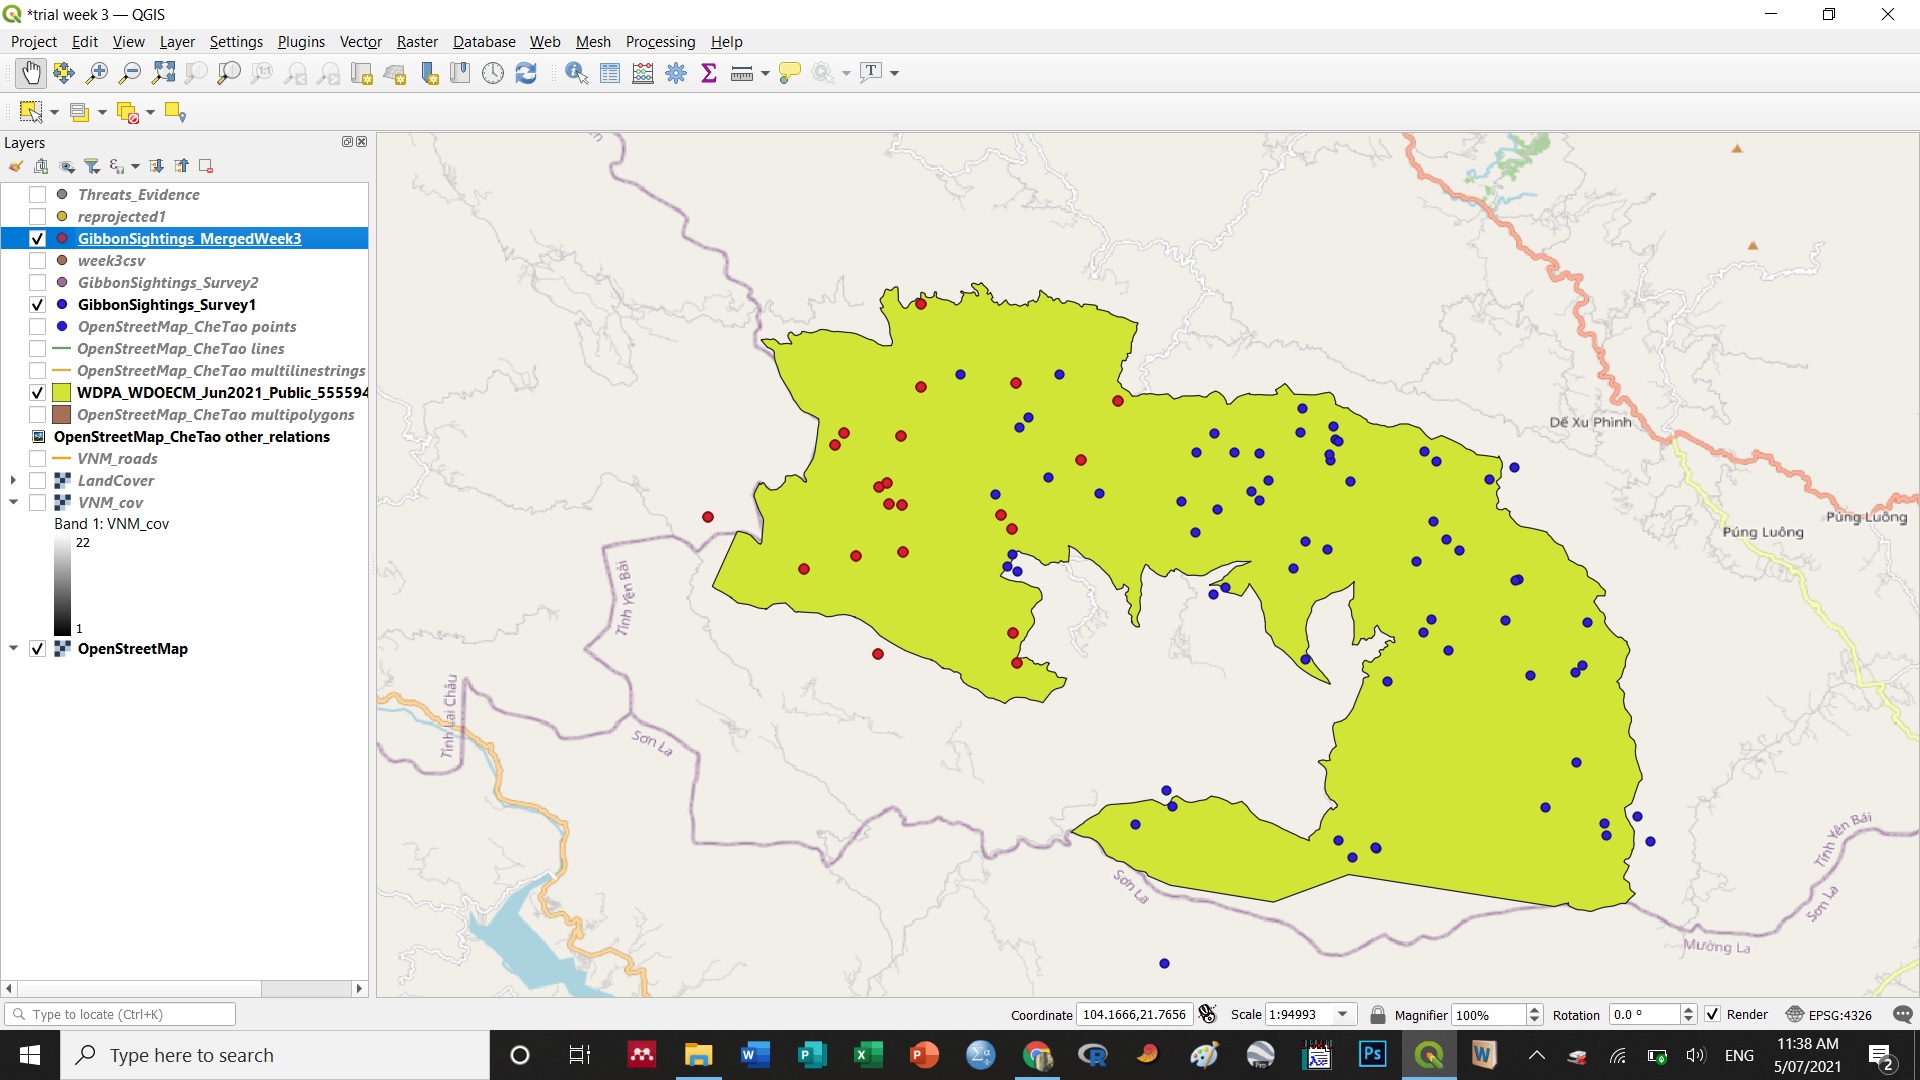
This week’s module was quite interesting as it covered my primary goal of enrolling in this workshop, really glad that I am now able to enter into QGIS point locations from a text file as well as reprojecting layers and merging files am sure this will come handy in the future in my work… I also had a chance to manipulate symbology of the points. I also enjoyed reading more on the different spatial reference systems and how to set one although still have a long way to go in grasping the new terminology utilised in this module.
1 Like
This module looked very interesting as it simplified the bulk of those ambiguous GIS terminologies for my understanding.
It’s certainly obvious that something is missing on my map. I hope I can definitely spot it with time.
Really looking forward to the next module. Thanks! Lucy.
Greatwork @Cee. Just love the output of you work. I think you have really captured the essence by the way each of you attributes are displayed. I may need your assistance if you will be willing to help. Cheers!
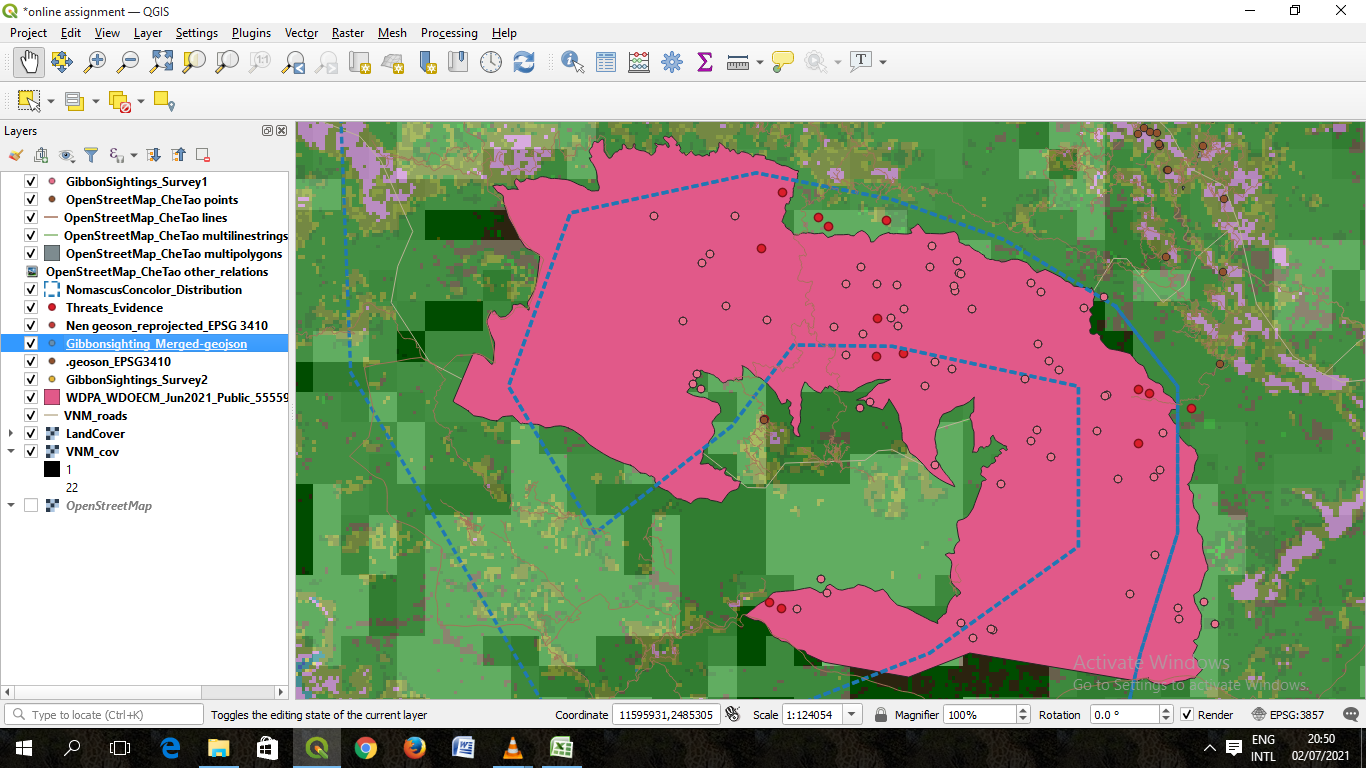
I am a little late to catch up on this assignment, but I am glad that I got it done. This assignment allowed for good practice on different types of coordinate reference systems used in GIS data representation. Specifically, I learned the difference between geographic and projected spatial reference systems. It was interesting to learn to reproject and merge the Gibbon surveys conducted with different coordinate reference systems. Learning to add text files using the “delimited” function was another skill necessary to perform data layering.
The EPSG codes and GS 84 / Pseudo Mercator in the Predefined Coordinate Reference Systems are still confusing, but the concept of different CRS and reprojections should become better with practice. I hope to utilize this skill in future projects.
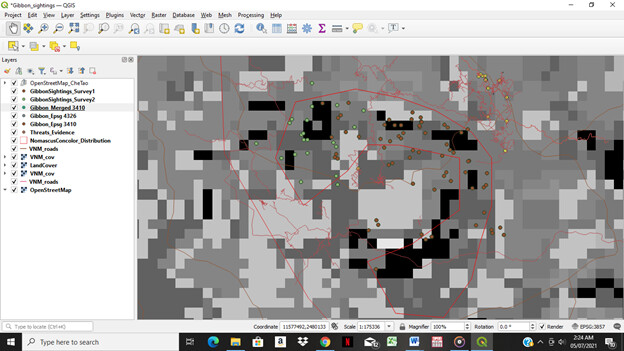
Hello, I like how you have kept the map on greyscale. Perhaps you could change the order of different layers (use your computer mouse to move layers up and down depending on your data representation need) and bring out the spatial characteristics of the Gibbon survey area.
Also, in each layer, you can use the symbology function (refer to module 2) to change the color and size of each data point.
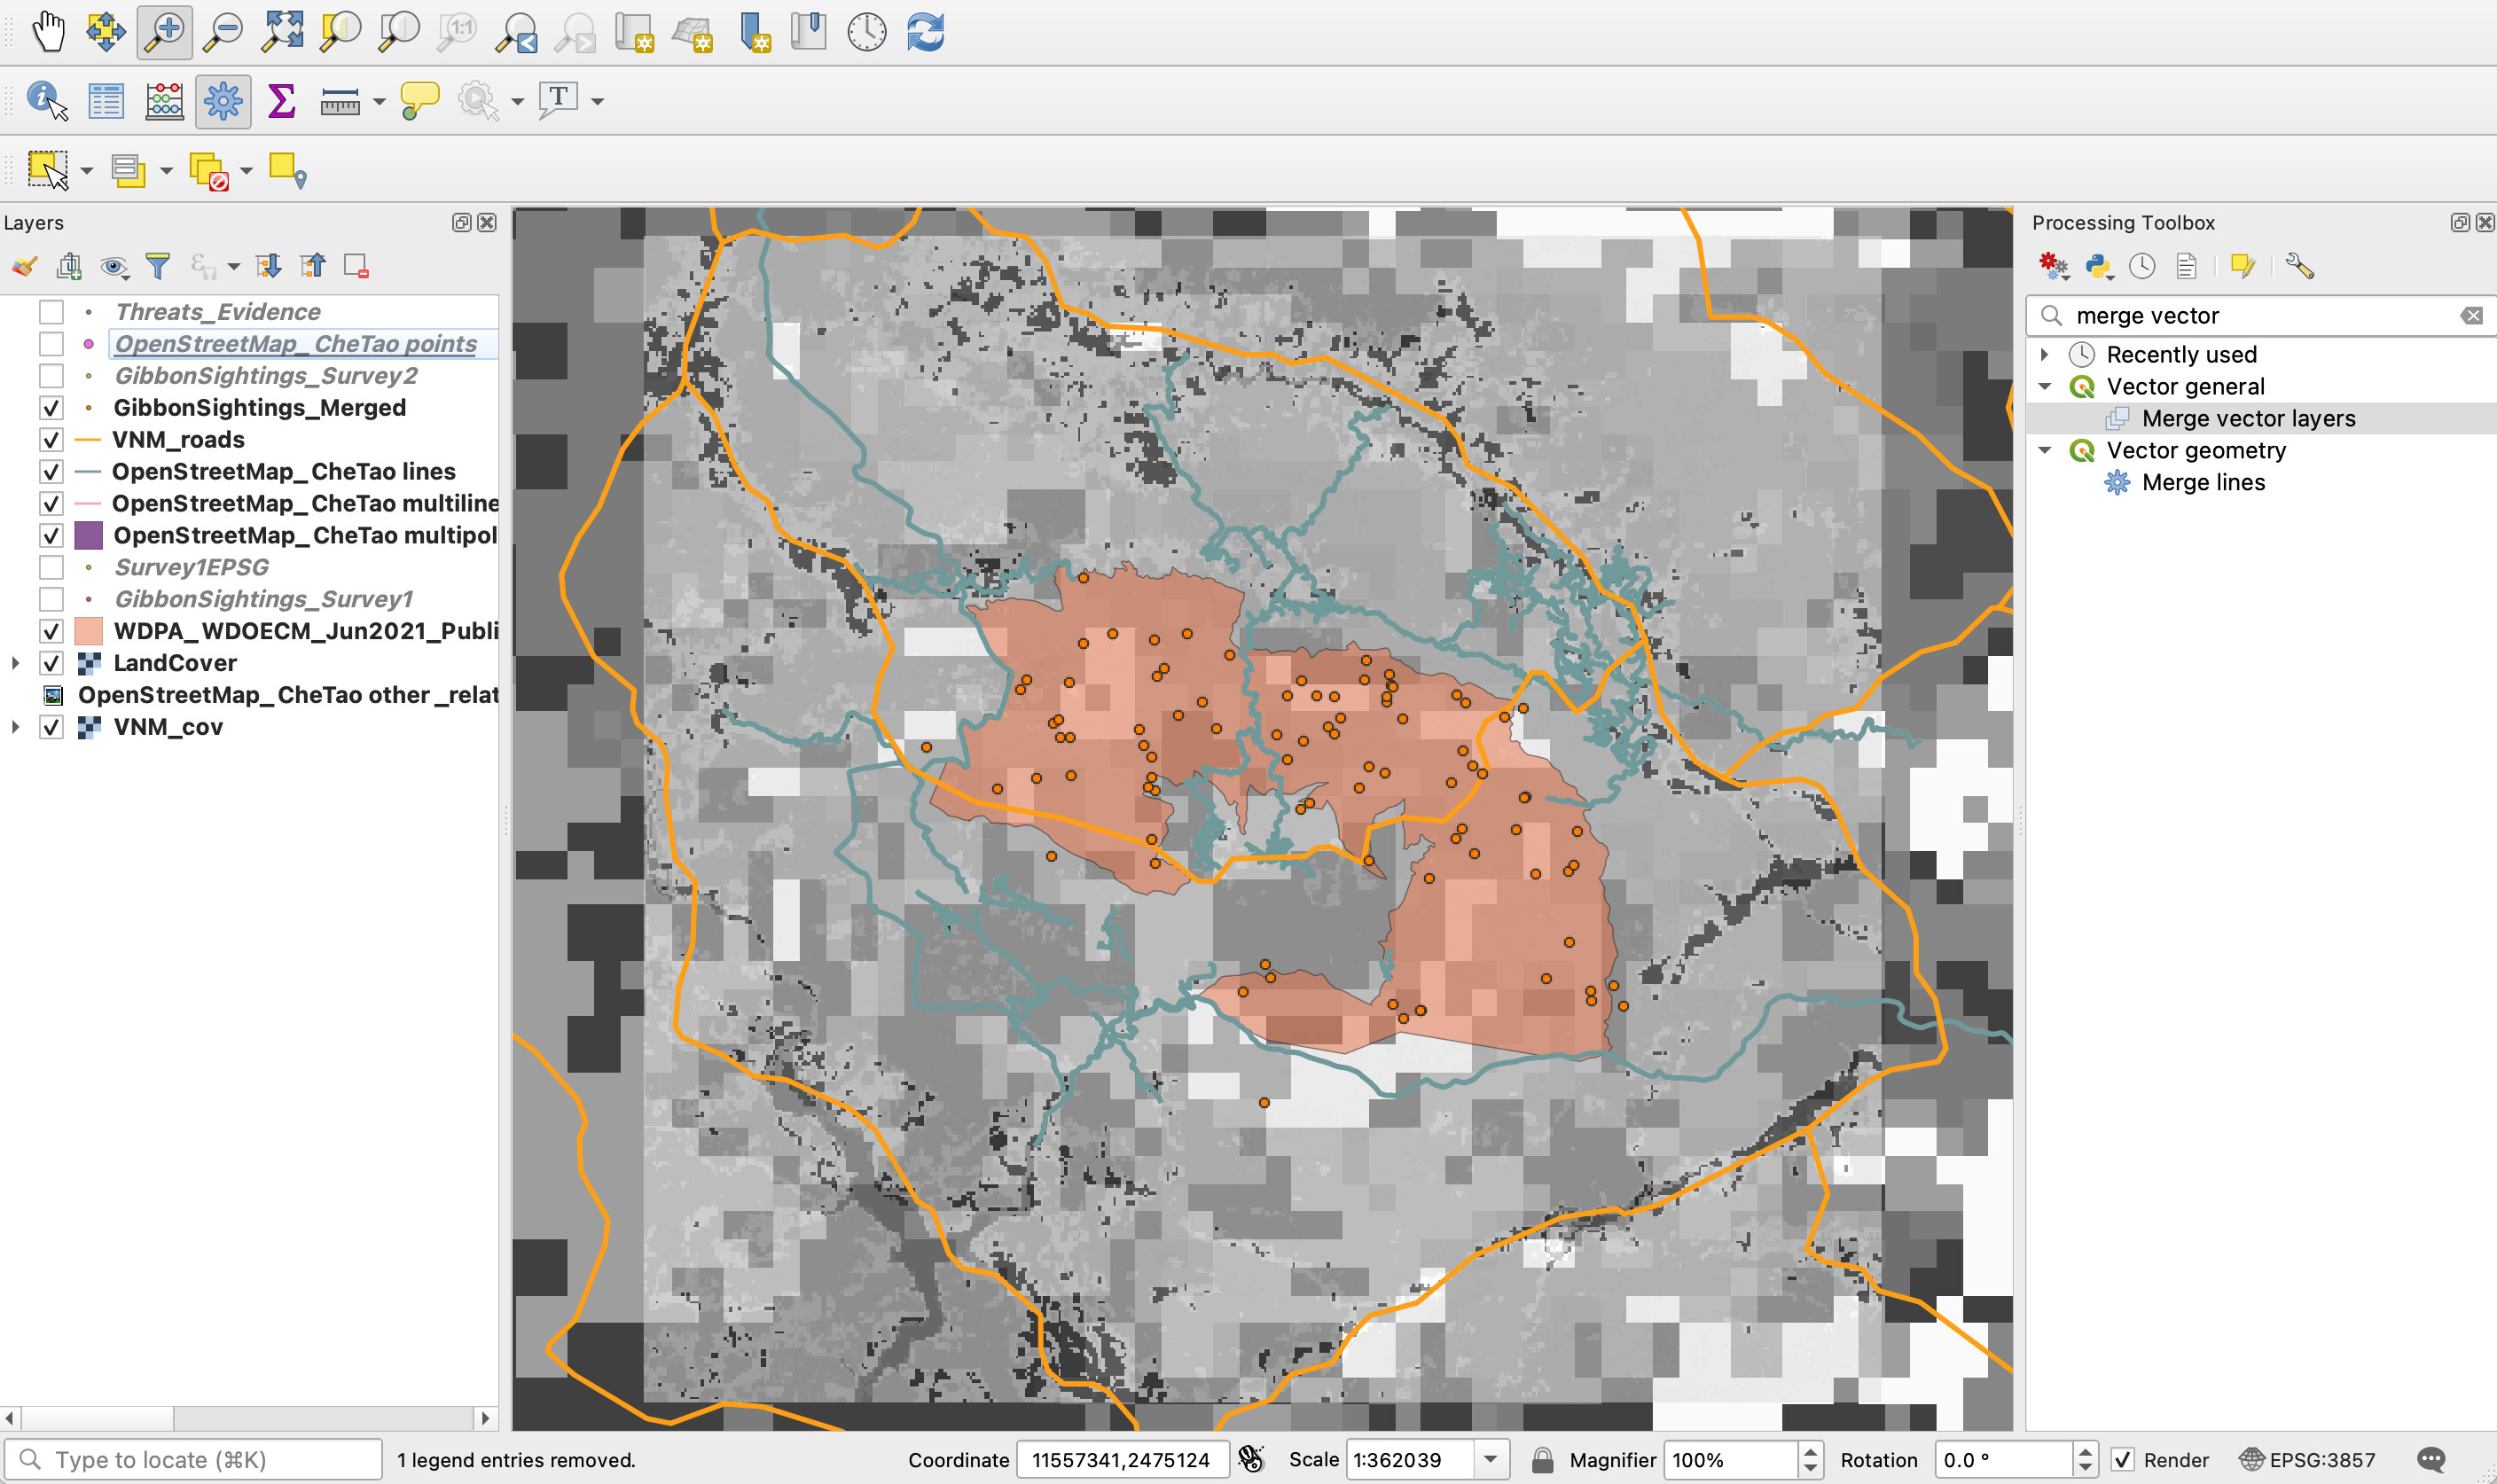
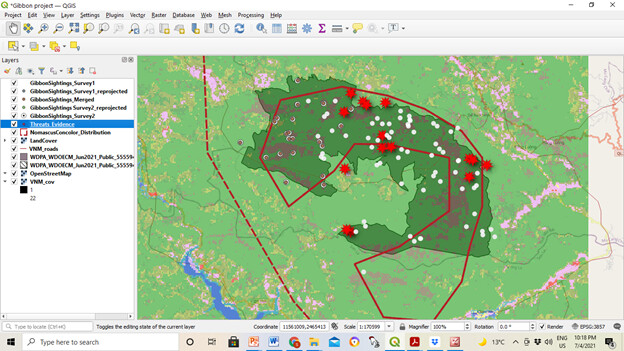
Module 3 seemed to step up the learning a bit. I found it very informative to read about all the different SRS’s and why one would select one over the other. I did hit a roadblock with this assignment as I found it difficult to follow the instructions when it came time to export the Survey 2 data. This might be improved in the future by more visual aids like the ones included in earlier modules. However after posting on the community forum and playing around a bit I found my issue and was able to create the map above.
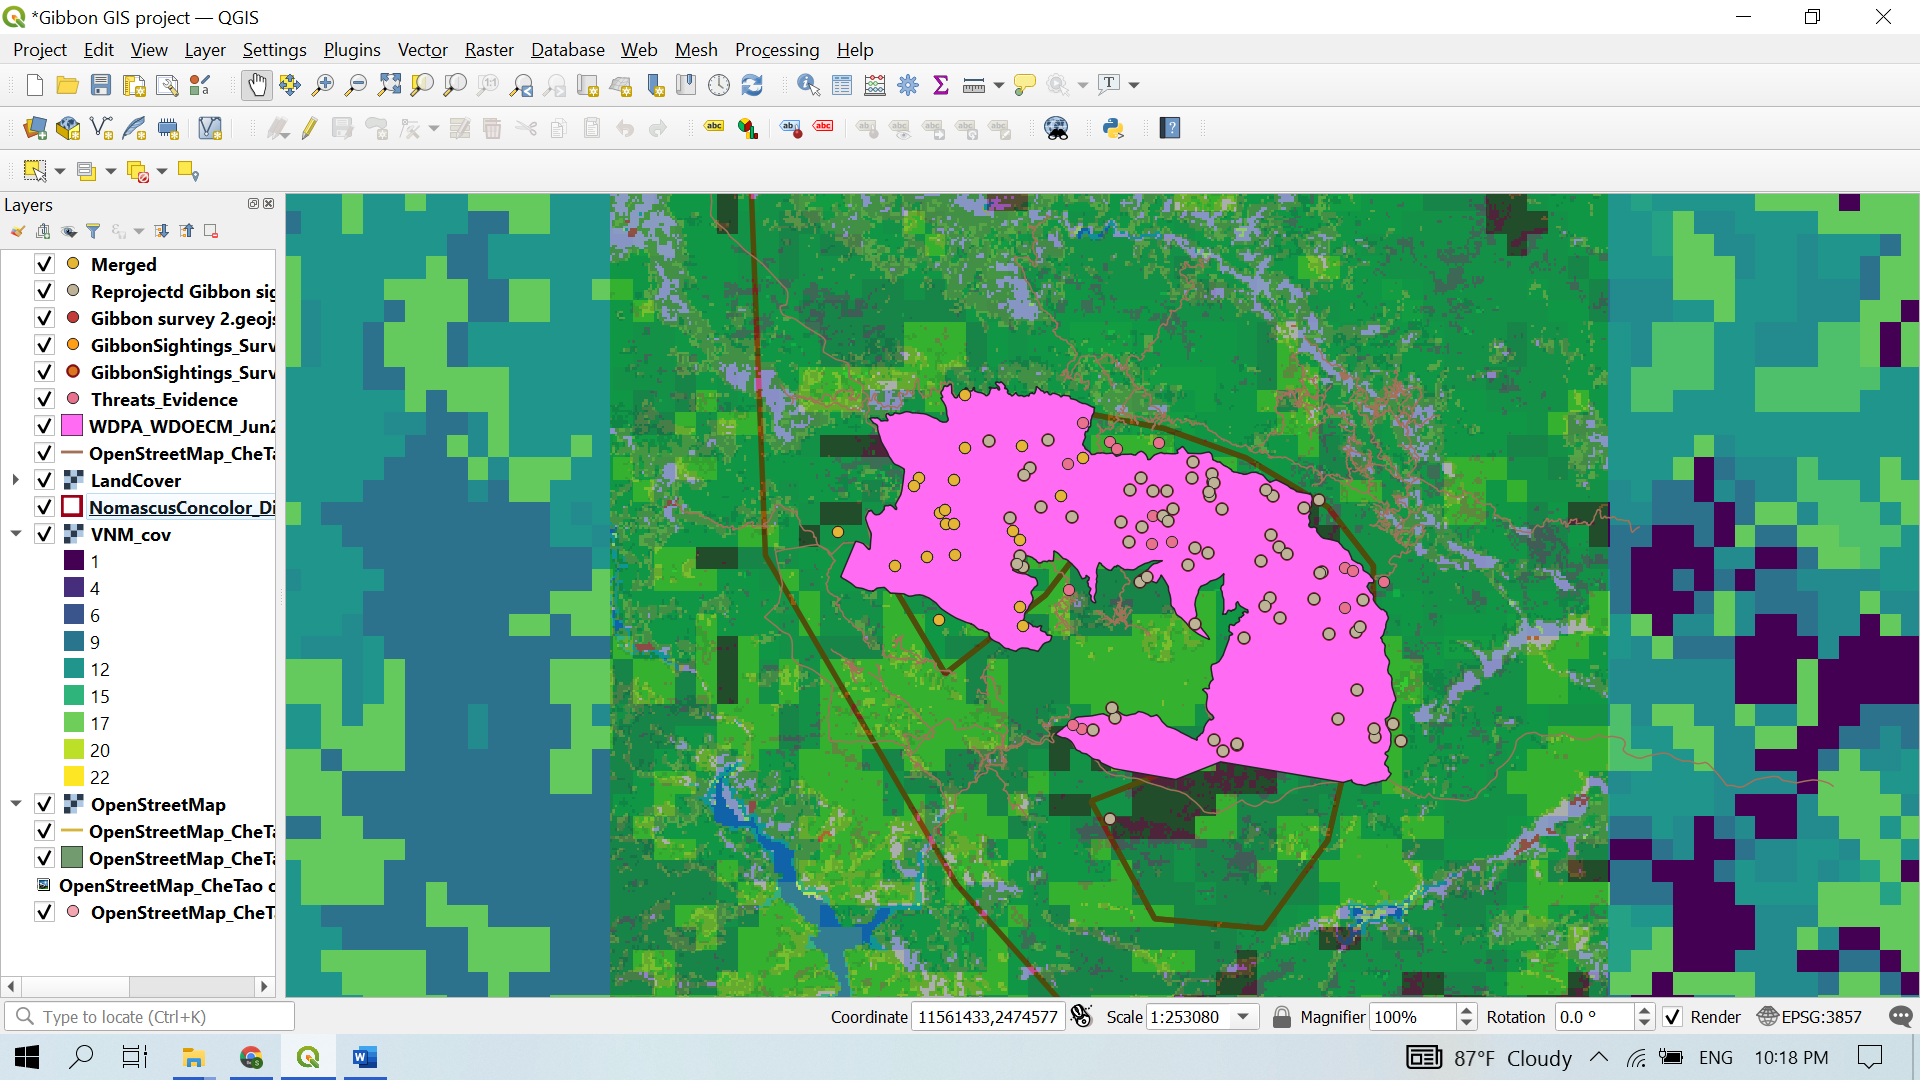
Great looking data! I always find it difficult to get the color scheme right for clearly displaying visual data but your figure is very clear.
I also ran into a similar problem with the gibbon sightings 2 data. Glad you were able to work it out though!
Thank you, I change the colors in symbiology. You can also adjust the opacity of the colors on it.
Thank you, I just change the colors through its symbiology. You can choose whatever you like and change the opacity in there.
X
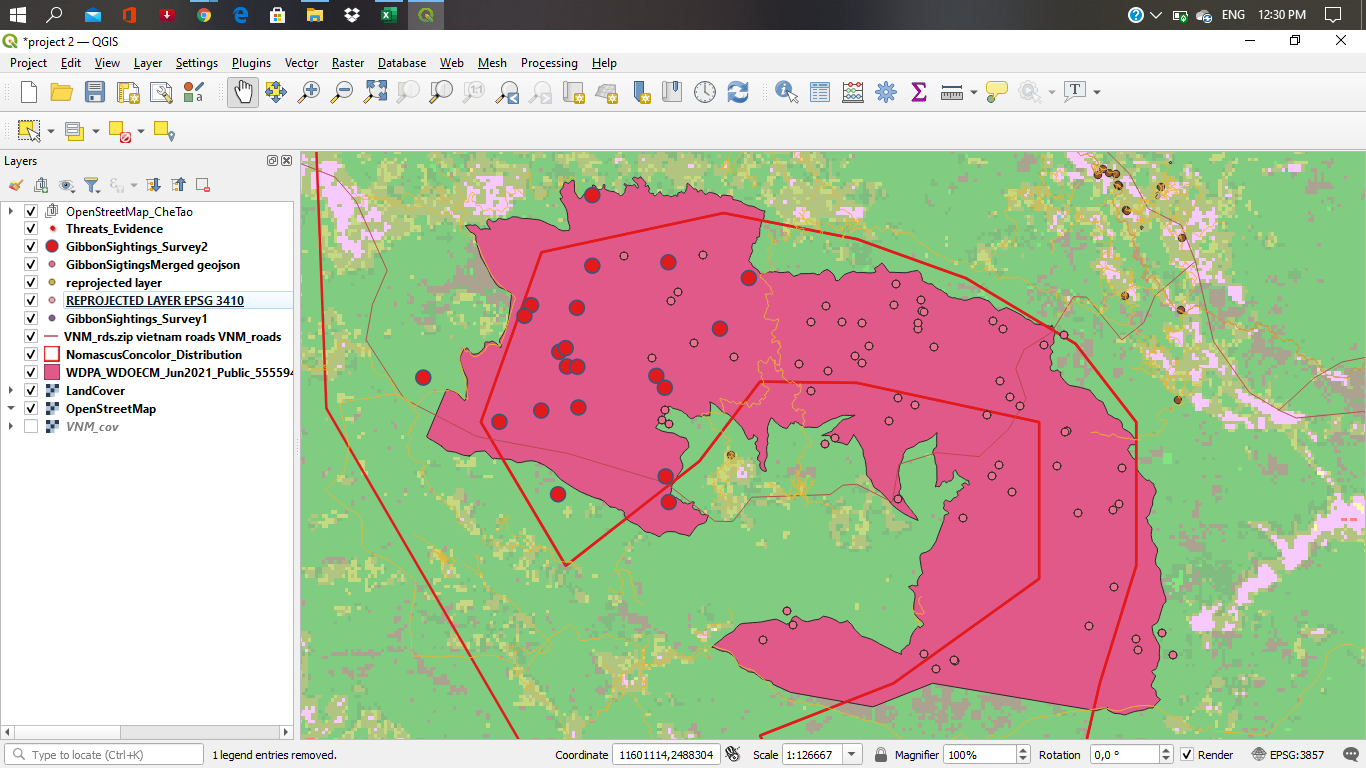
This module is rather difficult for me, but I was able to pull through. The instructions were strictly followed and that helped me to play around with the project.
I am hoping to learn more and get better.
I love your work. It will be great if you play around with the symbology and the the color
this is by far the most challenging module and i know there is something i am missing. somebody please come to my rescue.
also, i need thorough steps from exporting the GibbonSignhtings Survey2. i assume that is where i am getting lost.
and also how do i make my threats-evidnce to be visible on the map
1 Like
Hie @dani, looking at your map. seems you got all points right. i am not sure if you have specific points which i might have failed to pick up but you did well.