Hi @amkonefa thank you so much for your feedback, really appreciate it!
This module was a bit more challenging than the previous ones, both for the theoretical part and for a greater number of instructions to follow and new QGIS functions used. Even so, I think it didn’t turned out so bad, and I didn’t encounter any problems; I’ll just need to settle down in my mind all the theory information about SRS and map projections, but the basics are understood 
 .
.
This module was a little less clear for me, I’m still a bit unsure that I would be able to do all of this on my own without a lot of outside help. In this module I learned more about SRS, which I had never actually learned about before despite past experience using GPS systems. I think this knowledge is useful, especially the spatial reference website, for future GIS work/spatial research.
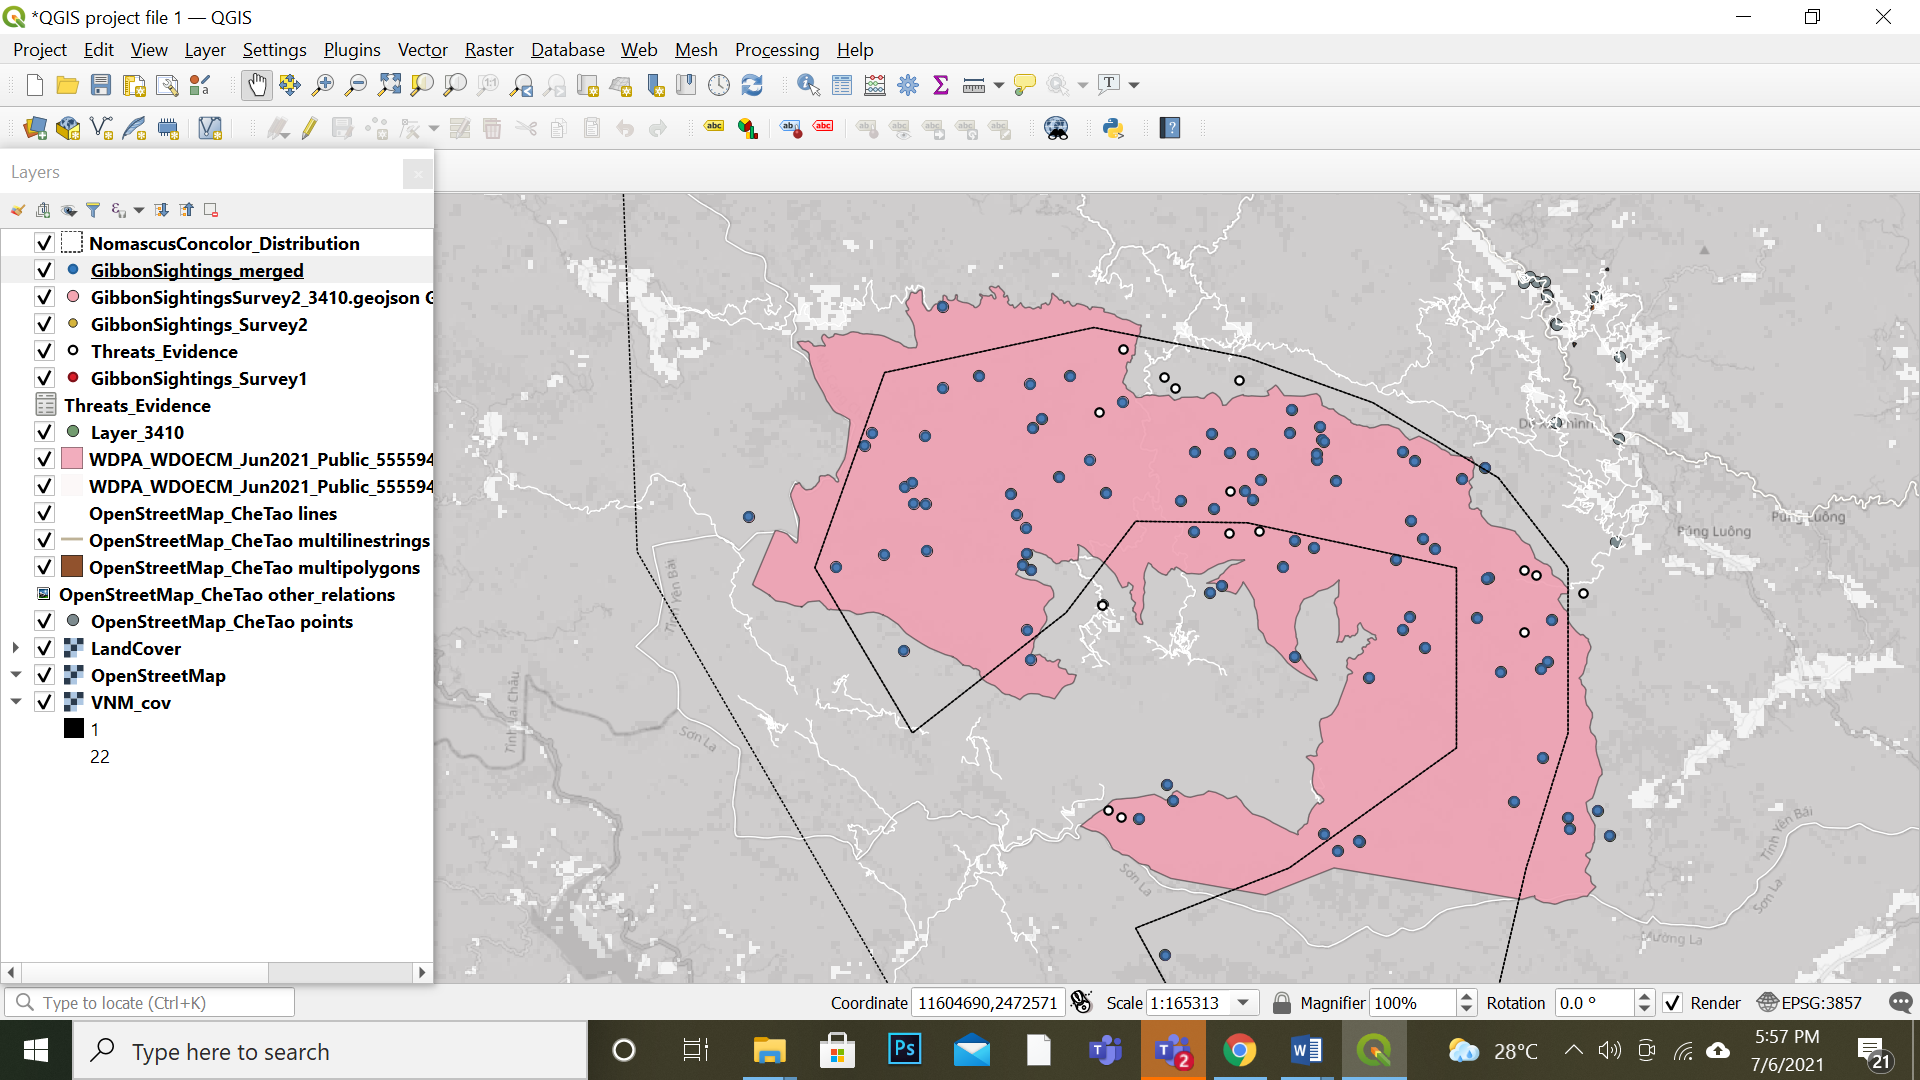
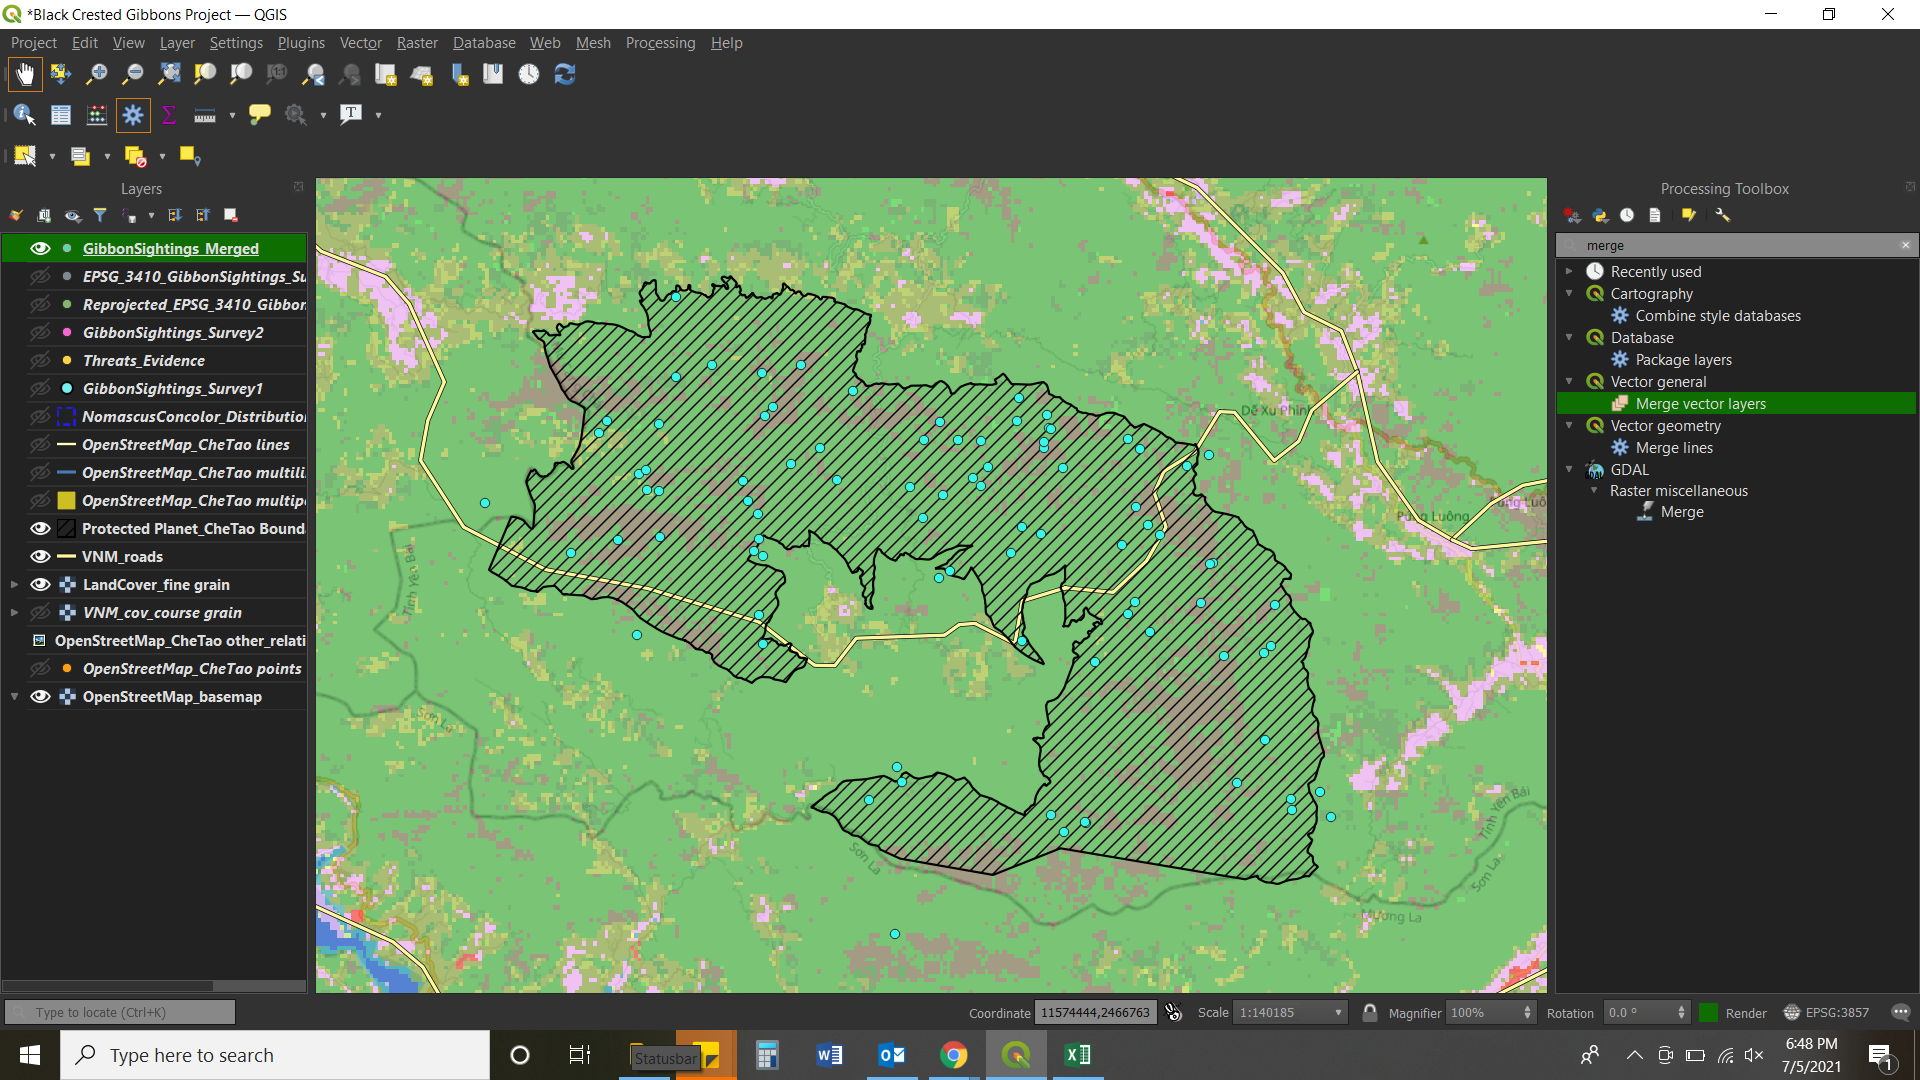
I was wondering for this map- are the data points merged? I like your use of color.
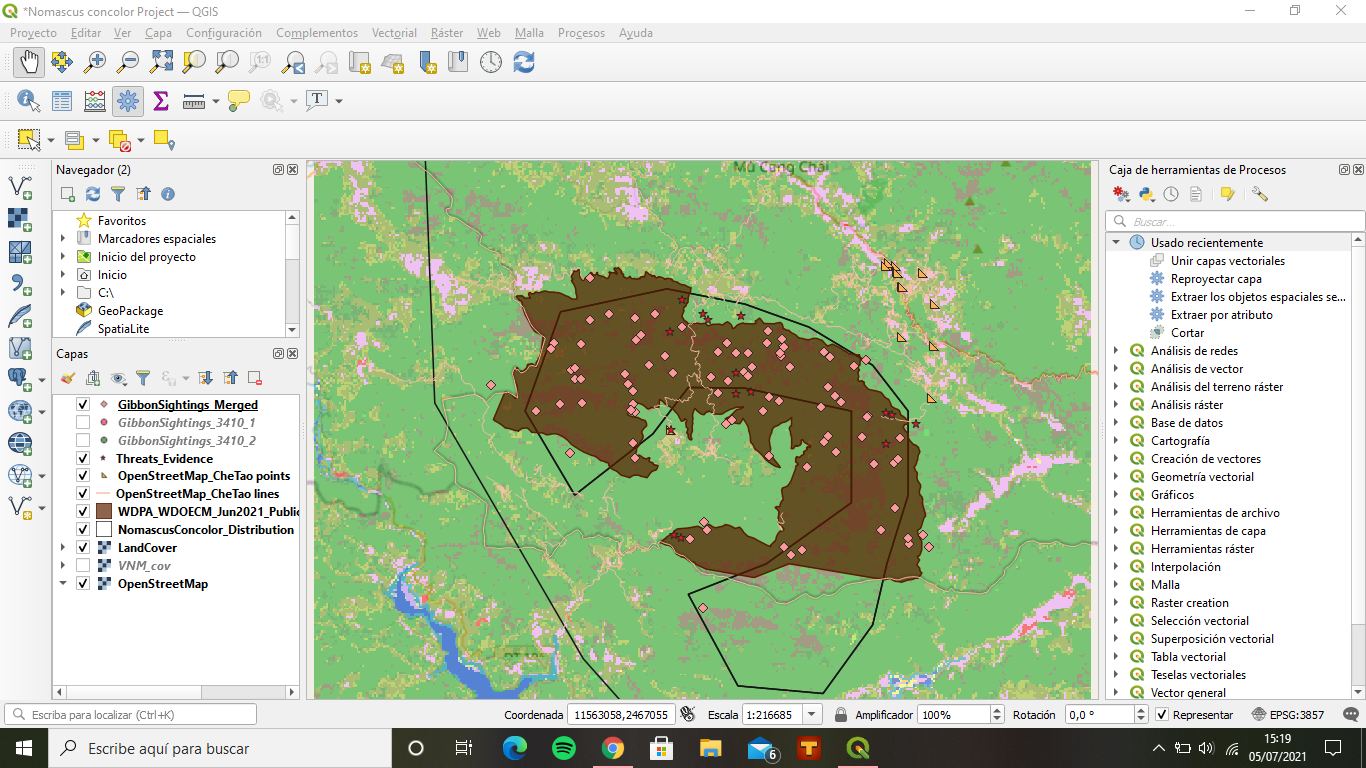
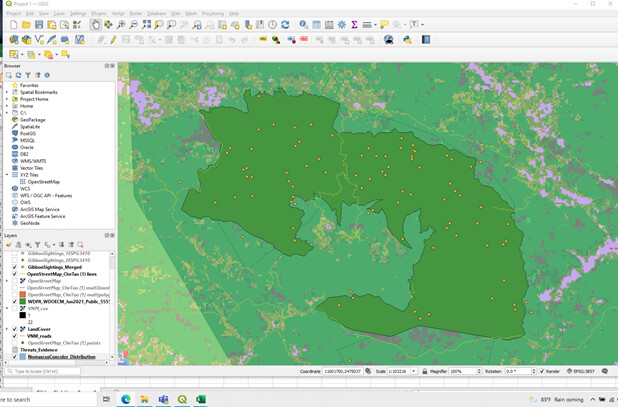
Hi there Jane! I really like how the land cover you used looks. As you say, including in a map like this the previous module layers has to be very interesting, especially the GibbonSighting_Survey1 layer and the Che Tao Nature Reserve boundary layer, because I think they match very well with the shadier area in the land cover. I’ll try to add this google satelite layer to my map next time!
1 Like
In this module I have discovered the different forms of map projection that exist, and from now on I will take them into account to work with my data. I ran into problems trying to join the two surveys but found that it was all a misreading and I was trying to join them as if they were raster instead of vector.  But I finally solved it.
@Irene I think the same, we have to take time to understand all this theory, but your work looks very good. 
1 Like
Wow, what a great map! I really liked how you worked the layers, the result was very nice, very good work.
This week’s module was easy to follow along with and implement the steps into my project. I understand the value of using different SRS for different applications; however it’s a very surface level understanding. If I were using my own data and making these decisions, I would need a greater depth to determine which would work best in my own applications. It might make sense to include a real-world example of why you would choose one SRS over another when explaining these concepts during the readings.
Hello Michael!
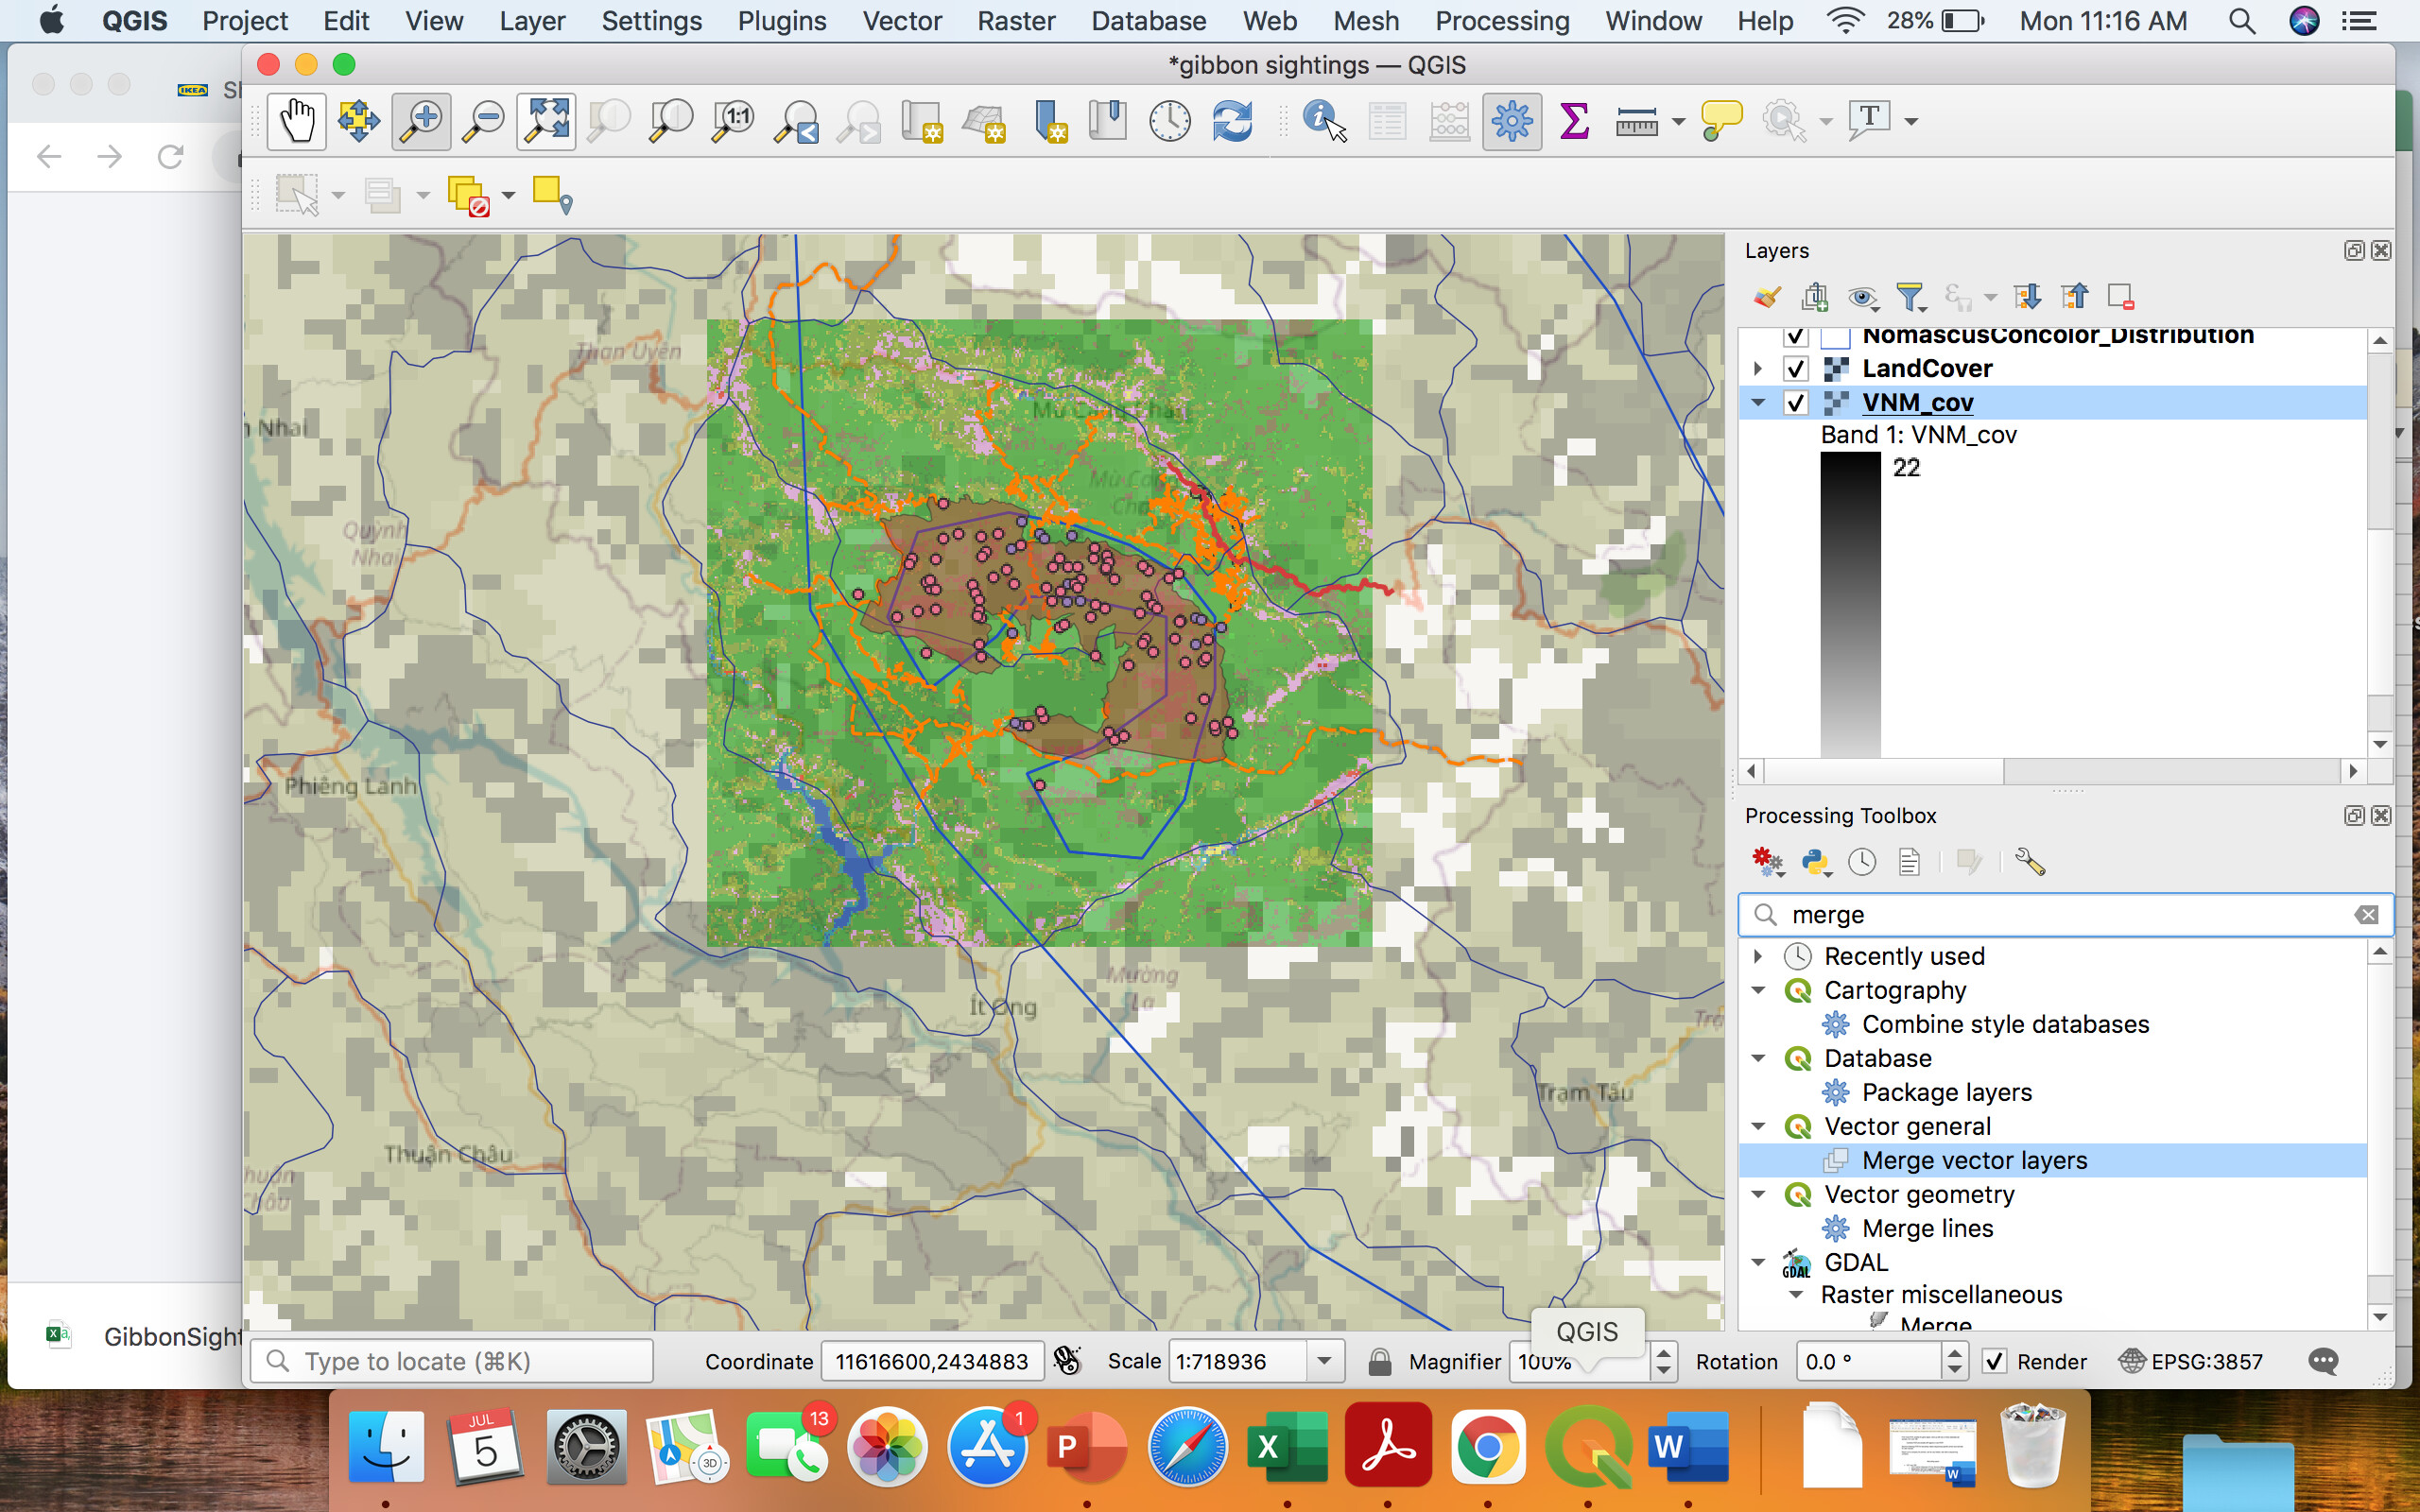
I think you are missing the park boundary that we added in Module 2.
I think this is the module in which I had most trouble with. I’ll have to revisit the concepts behind datum and SRS, also pay more attention to the reprojection part, since I don’t completely understand the logic behind that yet.
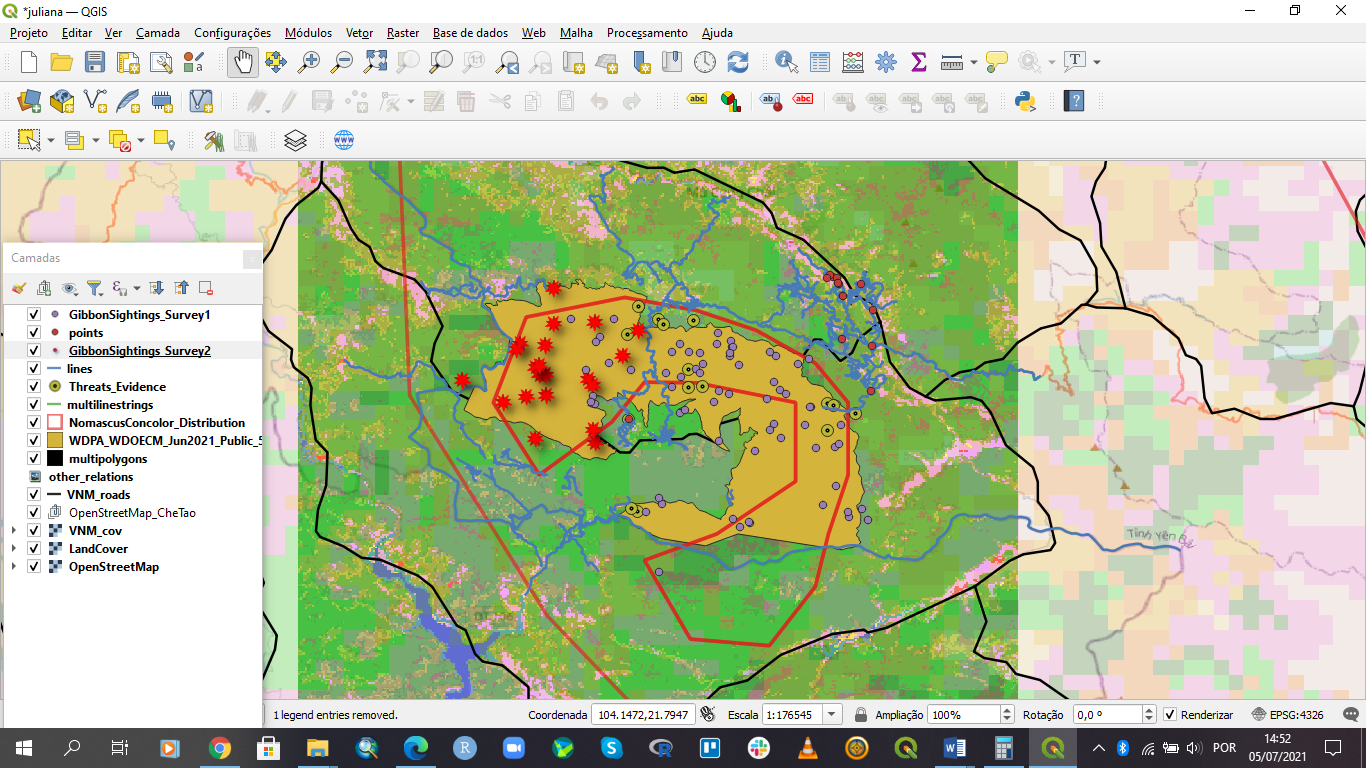
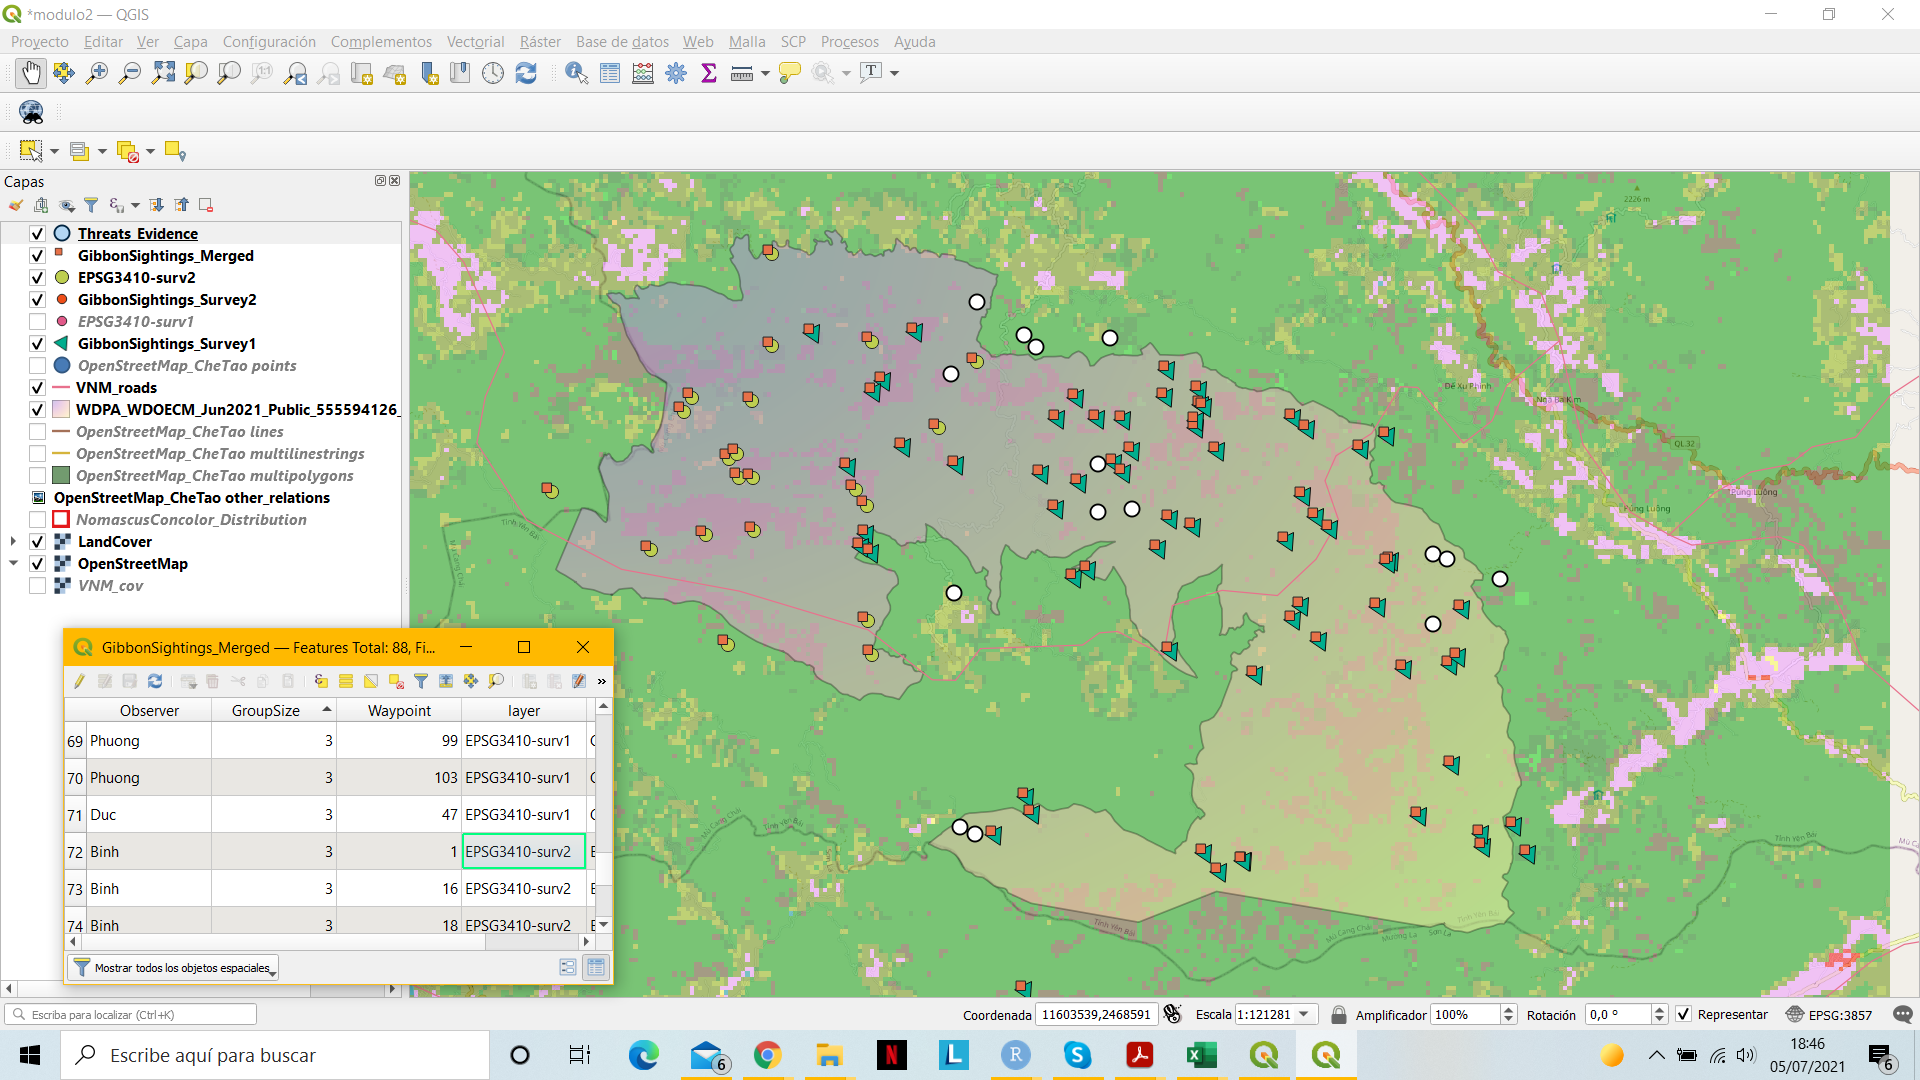
This one is beautifully organized! See you defined well symbols for each kind of point, that’s very useful. Did you add or eliminate any layer?
Adding data from a spreadsheet is awesome. I have a lot of data stored in spreadsheets, and after working with databases, I have learned to develop a certain structure to ease the import of the data. It is good to see that this feature will come in handy in QGIS as well.
Matching data sets and reprojecting - It will be much simpler to be able to combine datasets that have different spatial extents after reprojecting them into the same SRS.
Choosing a Spatial Reference – Until this course, I haven’t really looked into much about SRS. Most of my field work uses GPS data (Lat - Long coordinates). The information in this module has certainly made me think more about it. I have experimented in the past, and really goofed up some data because I wasn’t using the same SRS and was able to fix it after discussing with some GIS folks, but I was still foggy on the reason. Also, I realize that I need to be thinking more about the suitability and type of data used.
Awesome job, you certainly look like you have it figured out. I find that once I make a mistake, it sticks with me better, and helps me prevent it in the future.
I must confess that I had some difficulty as well. I needed to go back and reread some of the instructions a few times to see what I was missing. It was often very subtle. Good work!
Hi @MV_Marra
Thank you for your feedback! When you double click on the Landcover, the properties will show. I made the transparency to be 50% and in the symbology tab, I selected “by luminosity” for the grayscale option to make it grey.
Hope this helps!
1 Like
Thank you for your feedback!
What do you mean by “reprojected and merged layers”? Are you referring to the fact that it does not exist in my GIS, or?
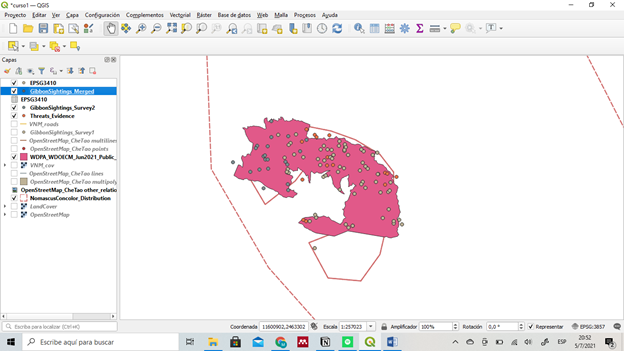
I like your choice of colors especially for the plots. it stands out well.