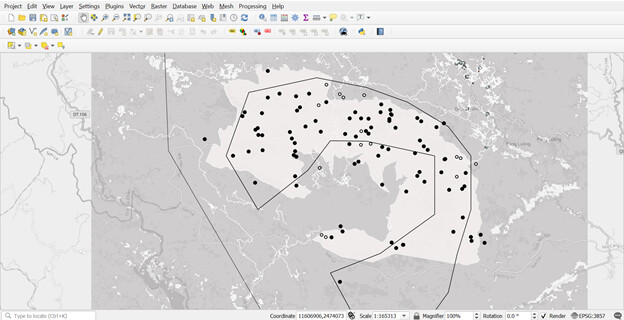
Your work and nice and clean and the survey data could easily be distinguished. Although, I suggest merging the GibbonSightings_Survey 1 the GibbonSightings_Survey 2 file as instructed in the module. Anyway, everything is nice with the color and the layering. Keep up the good work!
Module 3 is much easier compared to the previous modules. It’s also necessary to do some reading to figure out which SRS to utilize. I still struggling in finding the colour contrast. But all in all, I made a good and better output.
Yes, the instructions are an easy guide, but for first timer, configuring the software can become a task of few minutes. Overall its a good system to learn and broadcast ecological info.
In this module 3 which is about the angular coordinates which dealing with the comparison of the X and Y. In this module where we gonna do a comparing between the threats evidence and the sighting surveys. Where I find it easier one than the previous module and I find really fun in changing the colors to emphasize the comparison of the data being imposed to this project.
Thank youu!
I found the module a tad bit challenging than the other two. As a beginner my understanding of how to select a suitable SRS was a bit difficult but thanks to Lucy’s steps it was easier to follow and understand. Enjoying the course!
This module was a tricky one and kind of seems difficult but I tried all my best to follow every of the instructions and after all I was able to gain knowledge and understanding about the components of a spatial reference system,the difference between geographic and projected spatial reference systems. I was able to add point locations to QGIS from a text file and spreadsheet and lastly set the spatial reference system of a QGIS project. Thanks for this course it’s really an helpful one and am glad am one of the partakers
This module was really insightful as I was previously not aware of how many different types of SRS there were or how these needed to be converted to work with more than one dataset. I have already had some really good feedback which gave me some additional information about what type of SRS I should be using in the UK and for what kind of project. I am keen to actually work with my own data and put what I have learnt here into practice.
I understand that this module was about the different datum, SRS, how to transfer field data into QGIS using CSV files and how to make sense of them in QGIS. However amidst the process I still can’t have the same result as the others. To be honest I am confused. But I am trying and ain’t giving up. In this module, this one is what I’ve got. If anyone could teach me how to fix it, the same output as the majority has posted here, I’ll be very glad.
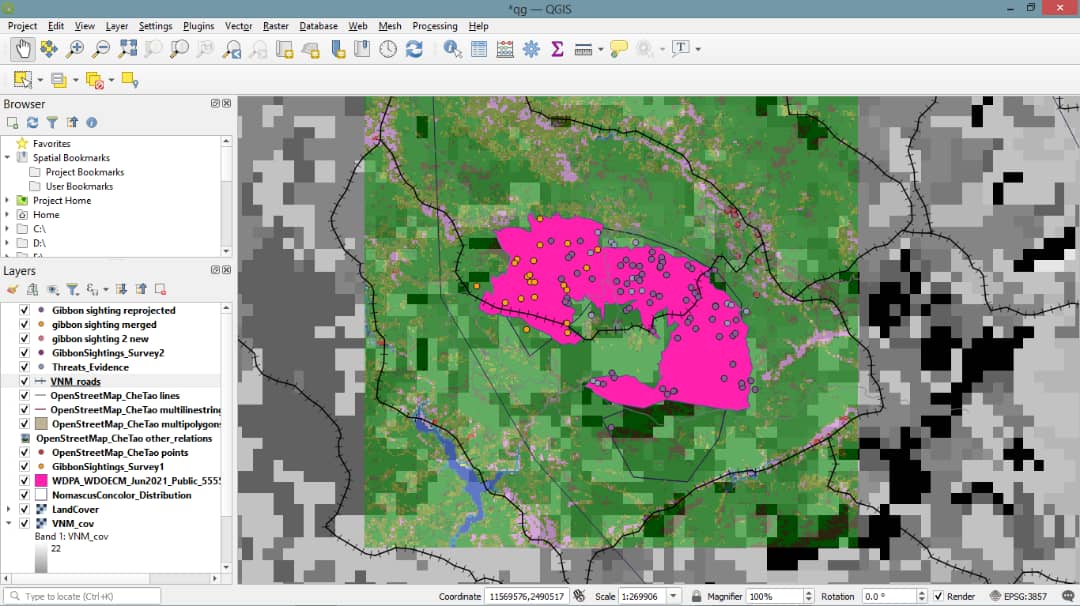
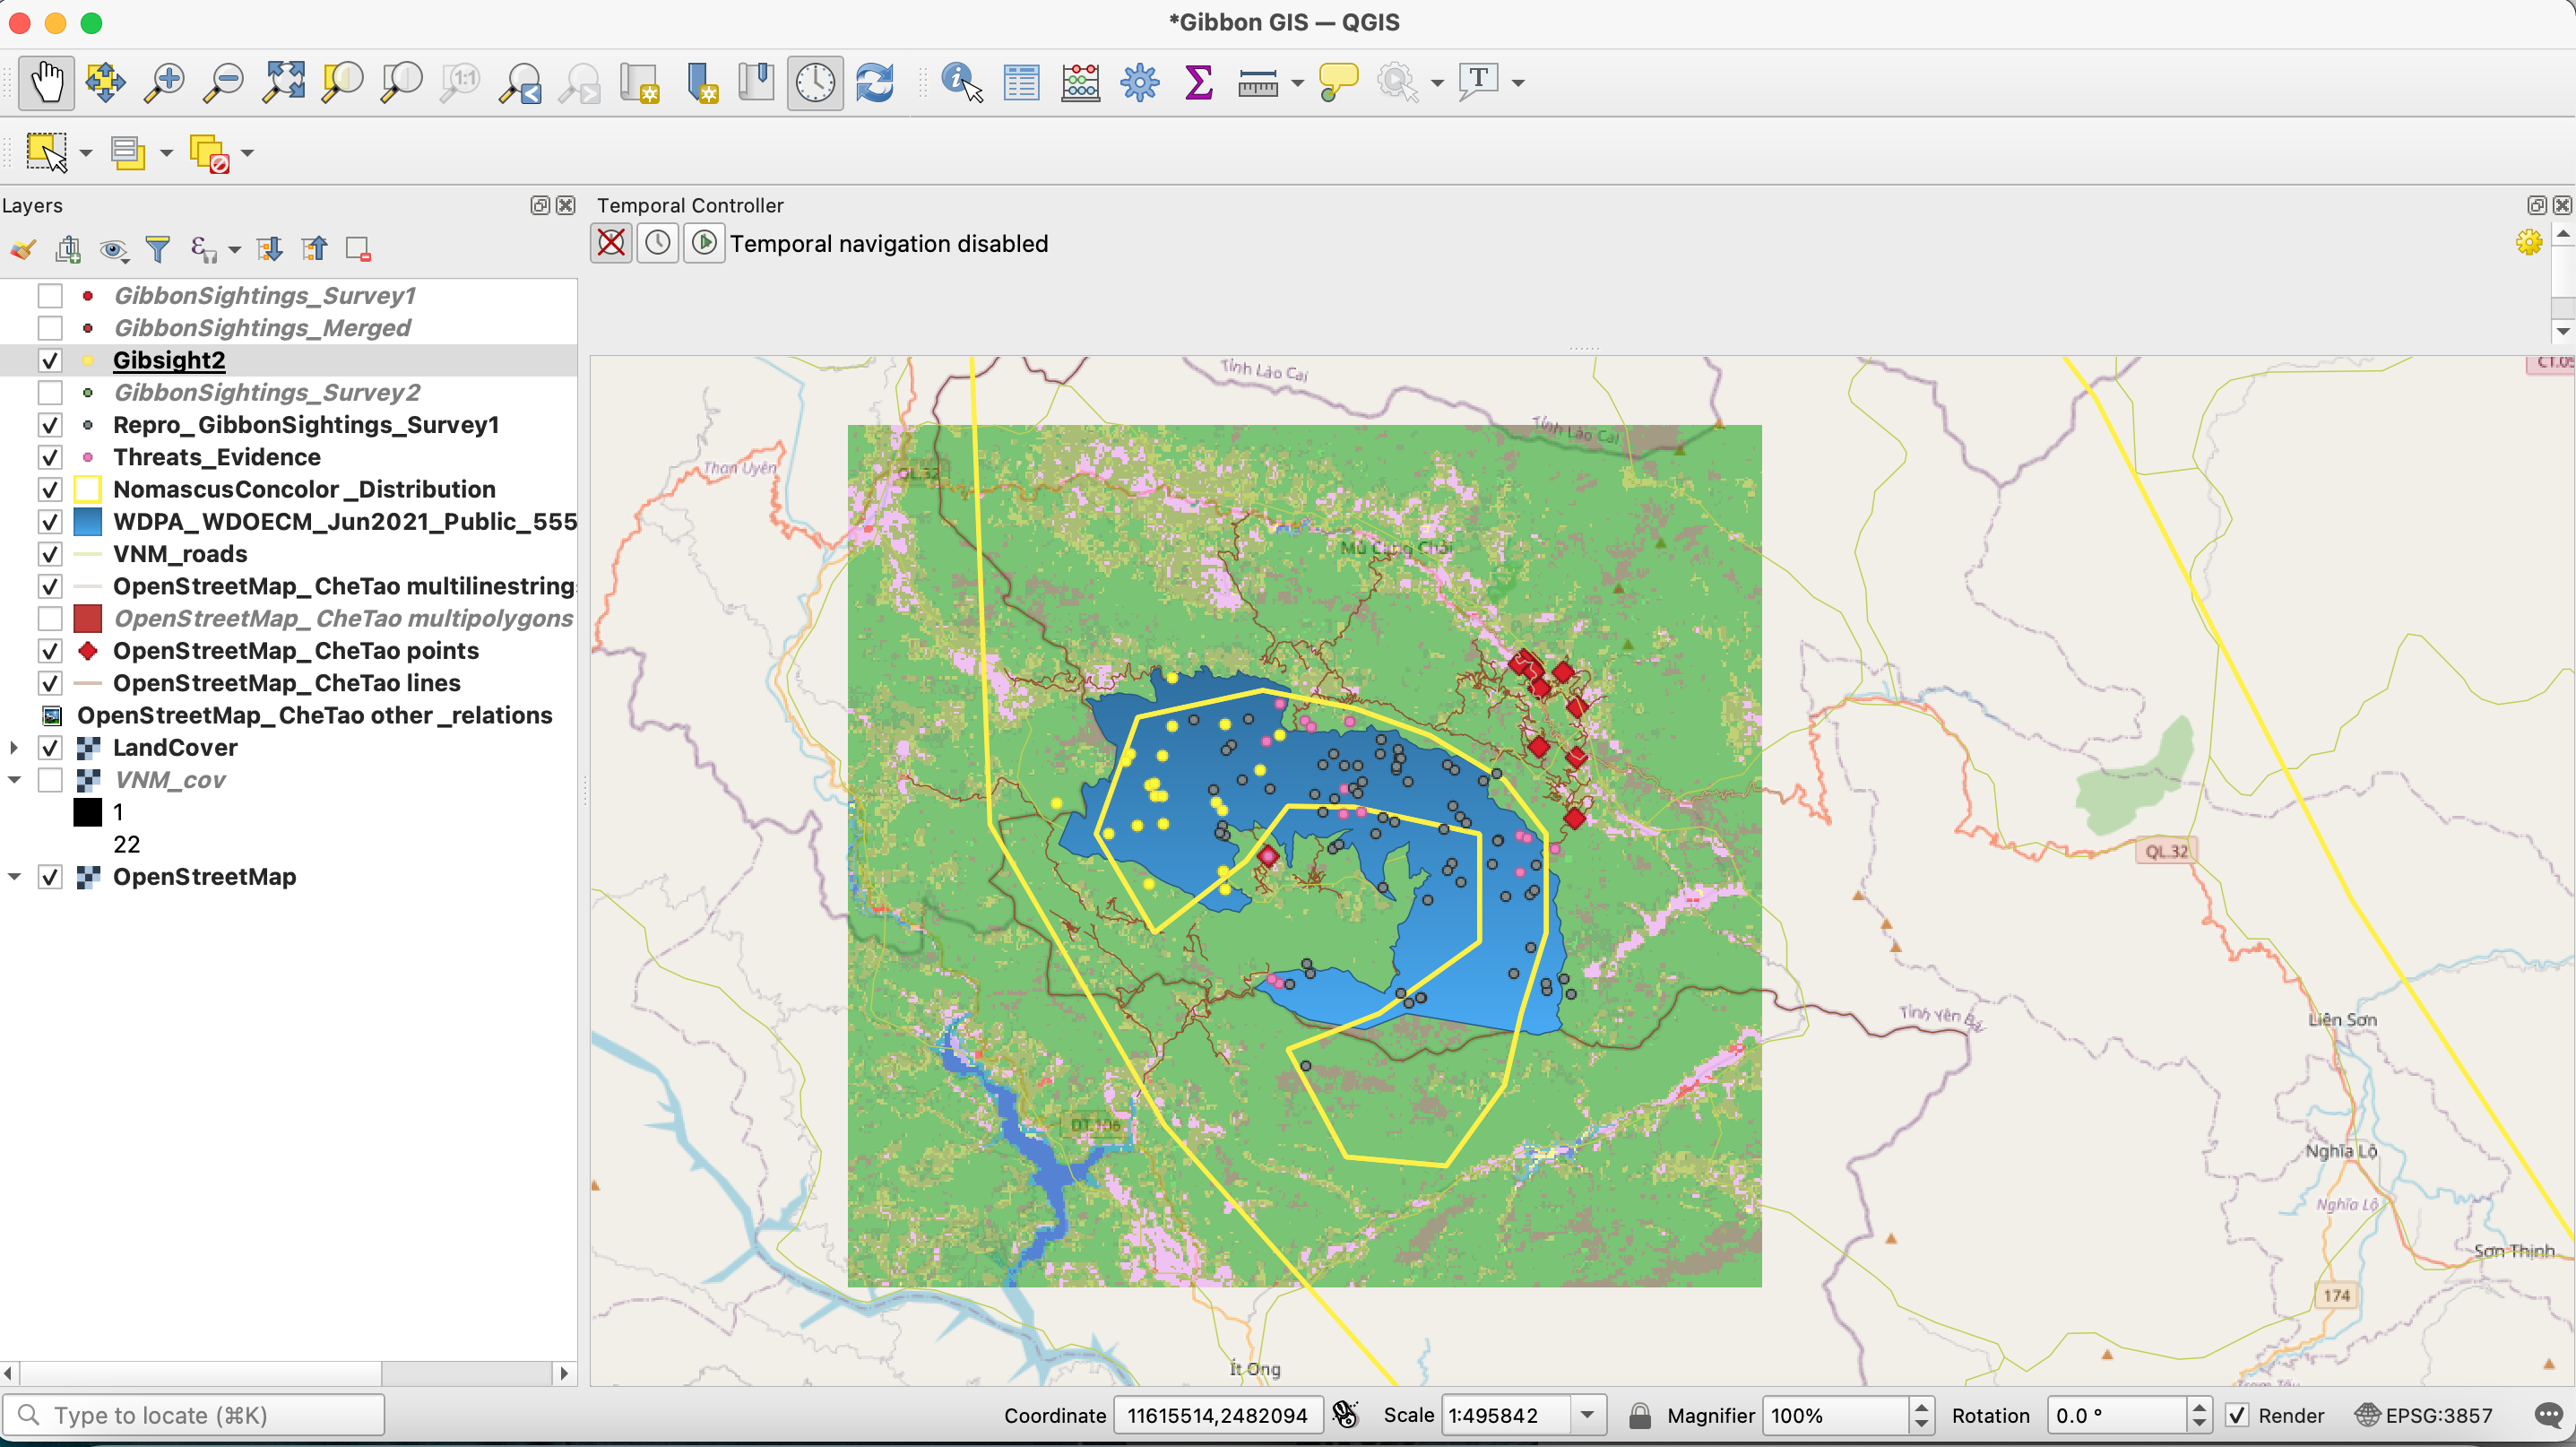
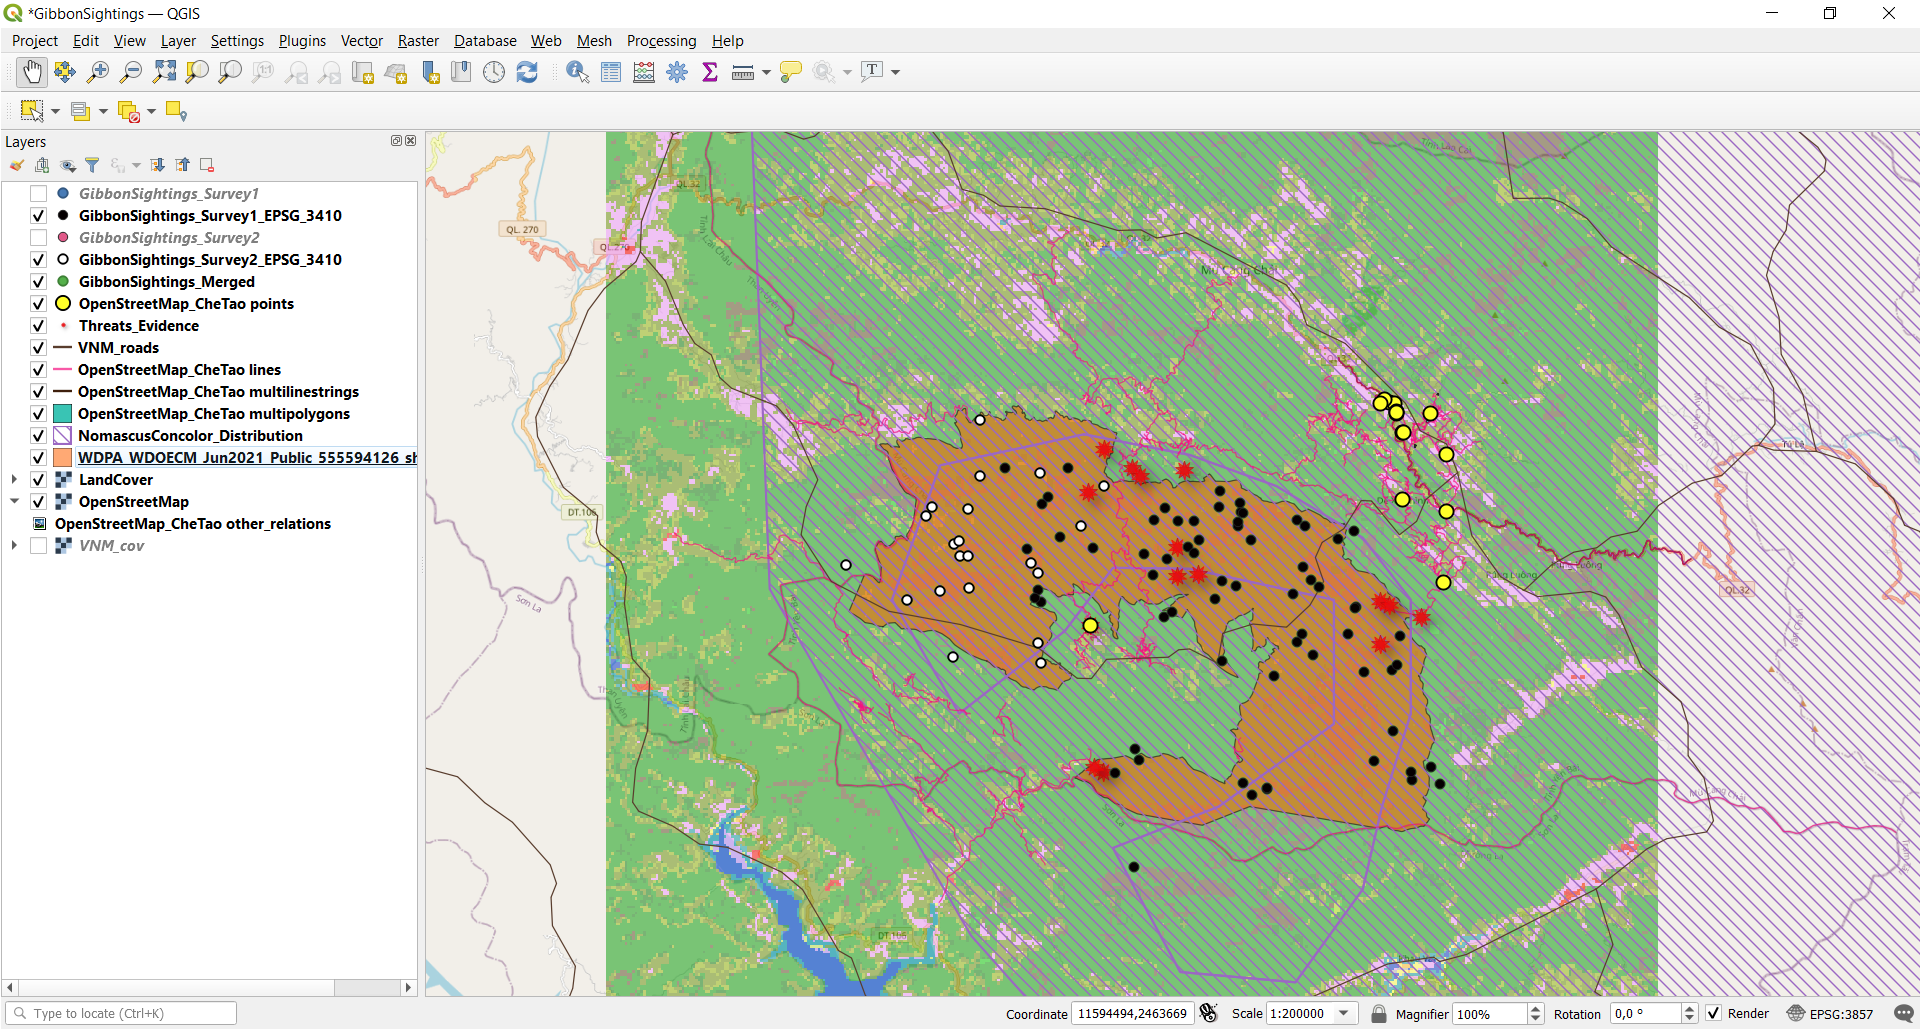
Thanks you! I added the merged layer over each survey layer so people can see that merged layer has both surveys. You can see the layers I have selected on the left side of the screenshot in the layers window.
Nice colors! And you chose the symbology of the points well. Your two gibbon sightings datasets have very similar symbols (because they represent the same type of data), and are clearly distinguished from the Threats layer.
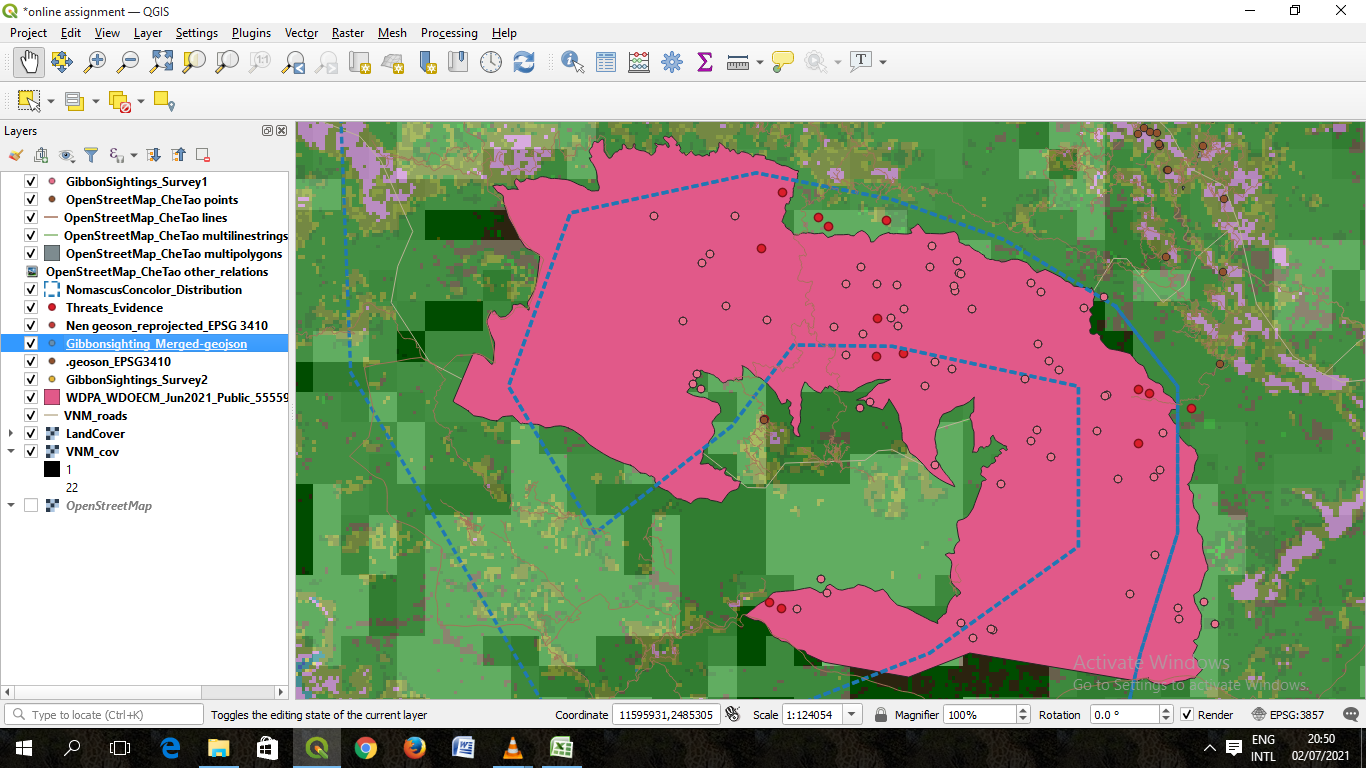
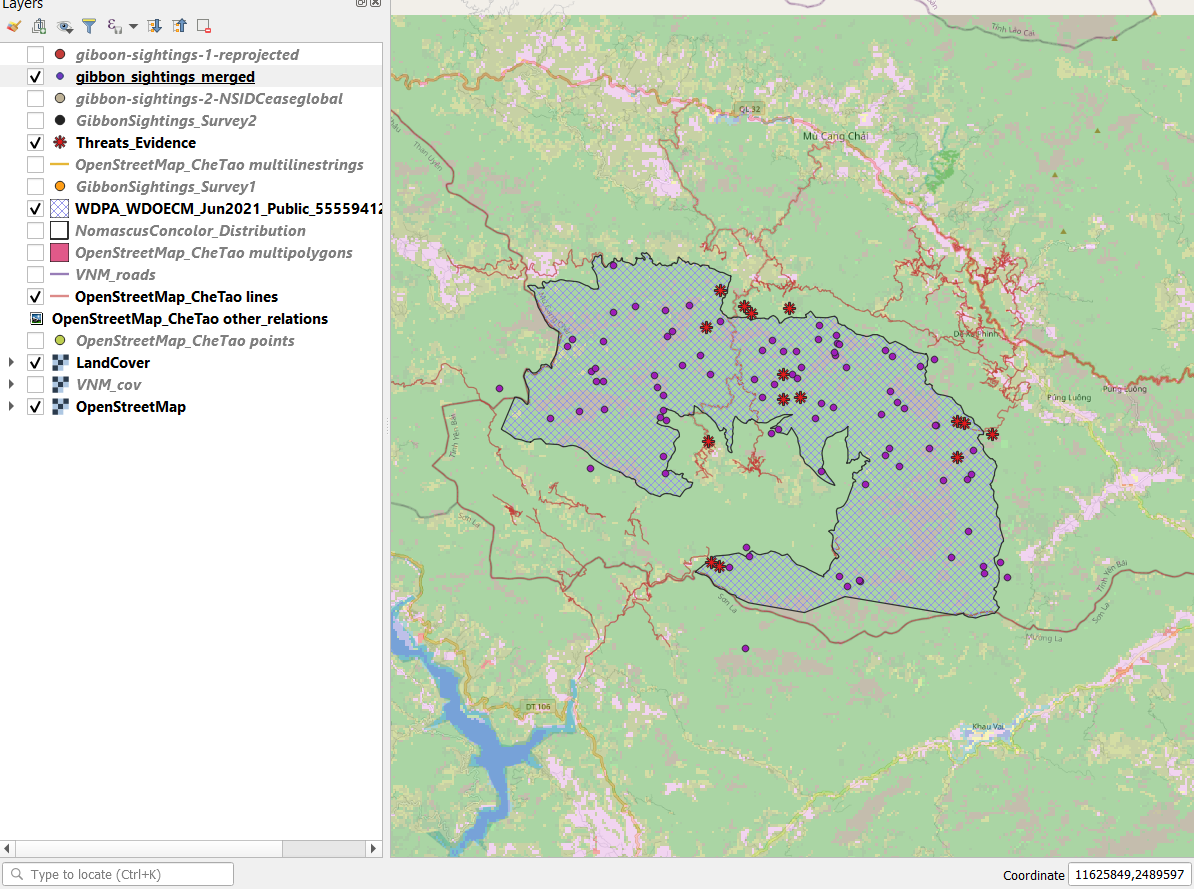
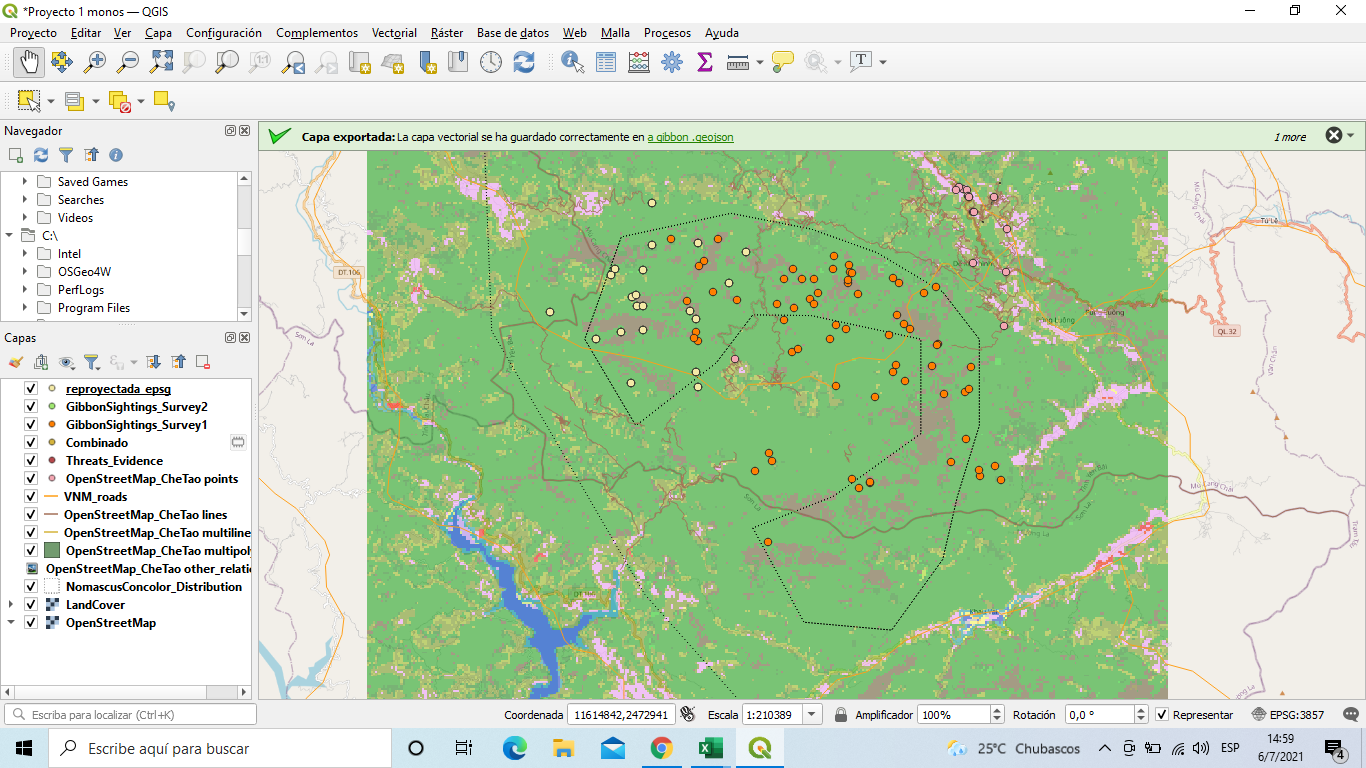
Personally I chose to keep only the merged gibbon sightings dataset and turned off the original two layers, so all the gibbon sightings points appear the same. It seems appropriate to consider them as a single dataset, although that would depend on what you want to convey with your map! The way you did it is nice, too.
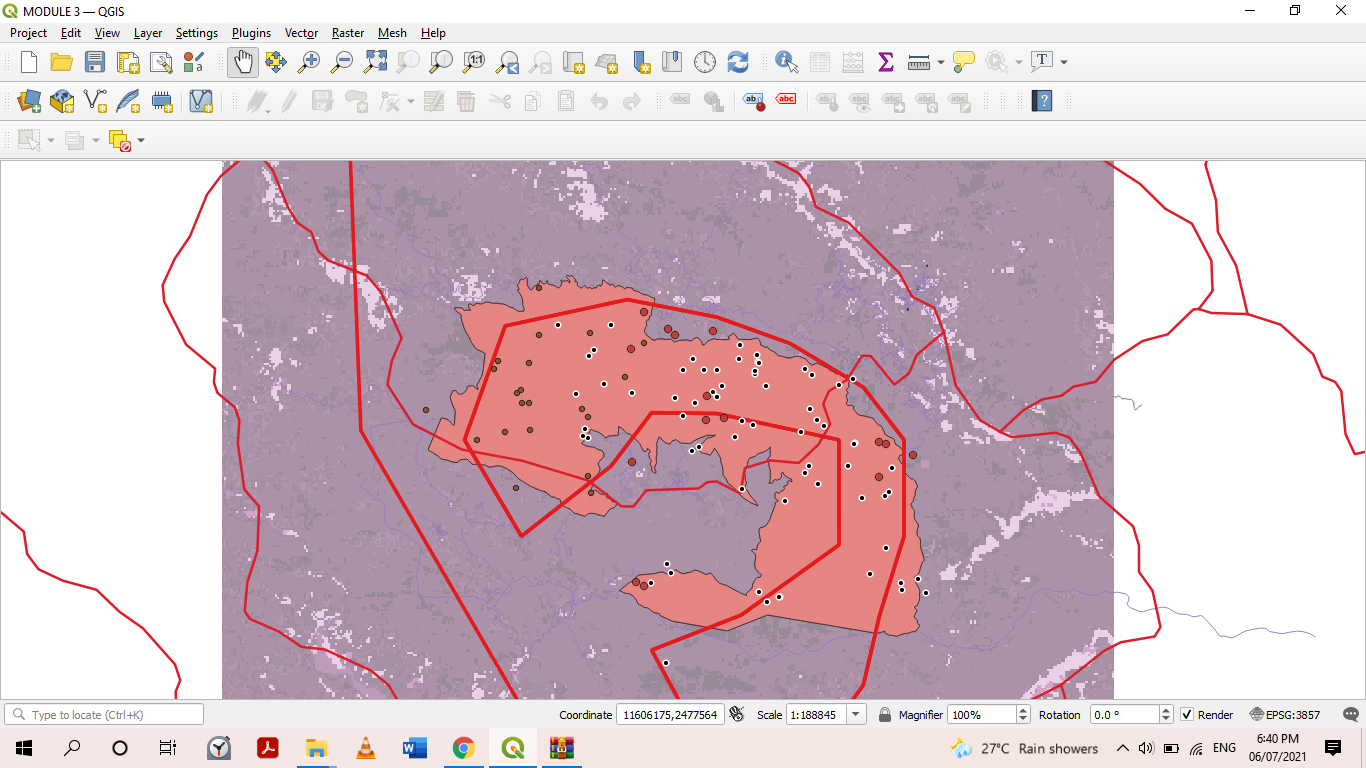
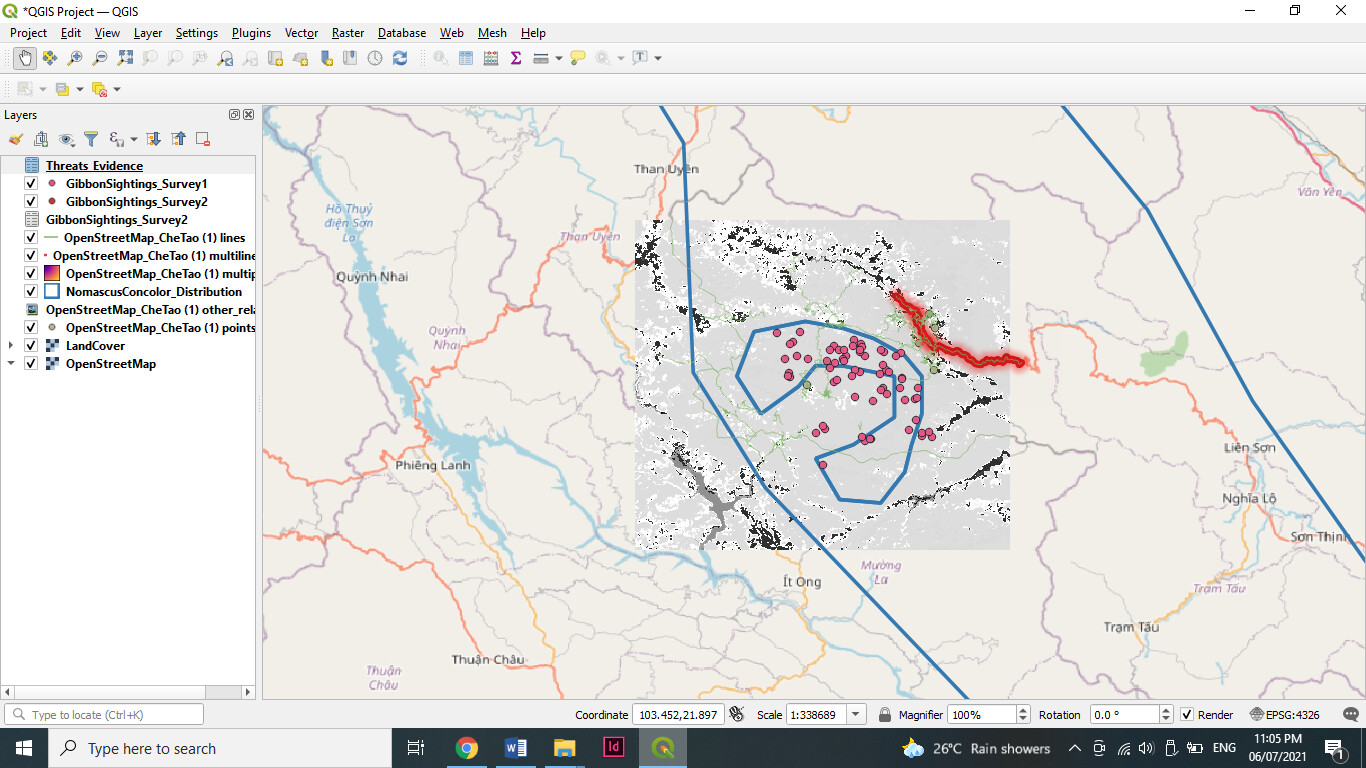
Here’s mine. I chose to only represent the merged gibbon datasets (small purple points) instead of keeping both gibbon_sightings 1 and 2. This seemed appropriate since they represent the same data–points marking where gibbons were spotted in the reserve–even though they were collected by different people. The threats layer is shown by red points.
This was the most challenging module so far. Some of the concepts and terminology are a bit tricky, but this was a great introduction. I hadn’t thought about the problem of representing a 3D object (the Earth or a landscape) on a 2D image so now I can see the need for the SRS. Also, now that we have gone over adding datapoints from a csv file and chosing an SRS, I feel a little more confident that I would be able to add my own data to a QGIS project.
This week’s lesson was very helpful in clarifying what I need to know when integrating different datasets since different layers may use different: Coordinates - lat /long or a projected coordinate system,Map Projections, and different Datums.
Also, i can now describe the difference between geographic and projected spatial reference systems,and setting spatial reference system of a QGIS project now and more.
Thanks
I think I followed the instructions pretty well, and I think I did ok when I wanted to repeat the exercise on my own. But it’s getting quite tricky for me to remember all the steps if I don’t practice. I still don’t think I would be 100% confident to determine which SRS to use for my data and would probably ask my colleagues for advice.
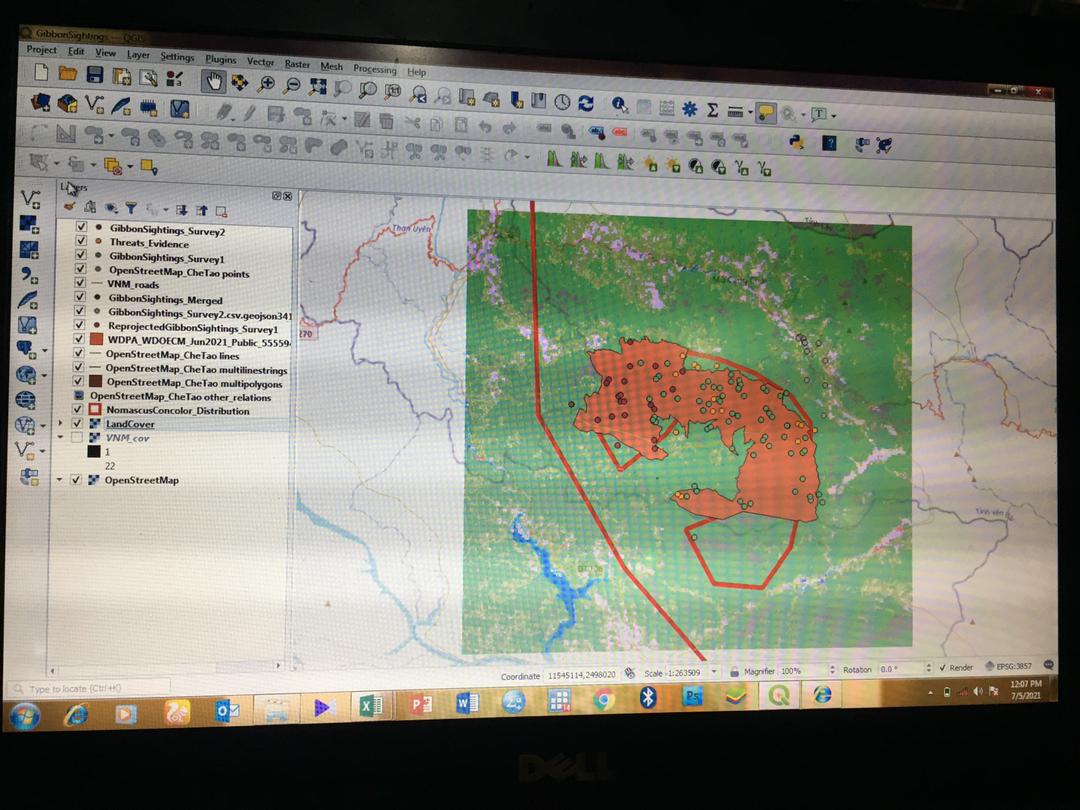
In my assignment, however, I decided to highlight Survey1 and Survey2 in EPSG_3410, and right below them are the merged points.
Great display! I also decided between this and between the individual surveys, and though I have decided on the latter, I totally agree with what you have written.