Hi @reupenacaray your map looks great and you are right the screenshots helped in this module for sure
1 Like
I found the different spatial reference systems really interesting. I’m currently a student and I don’t have a GIS project of my own. Also I was unable to download the reserve boundary in module 2, so that is still missing from my map. There is obviously a lot that you can do with this program, but I think it would take quite a bit of practice to become familiar with all the different analysis options.
I really like what you’ve done with the colours. Does it reflect some underlying topography or vegetation or something?
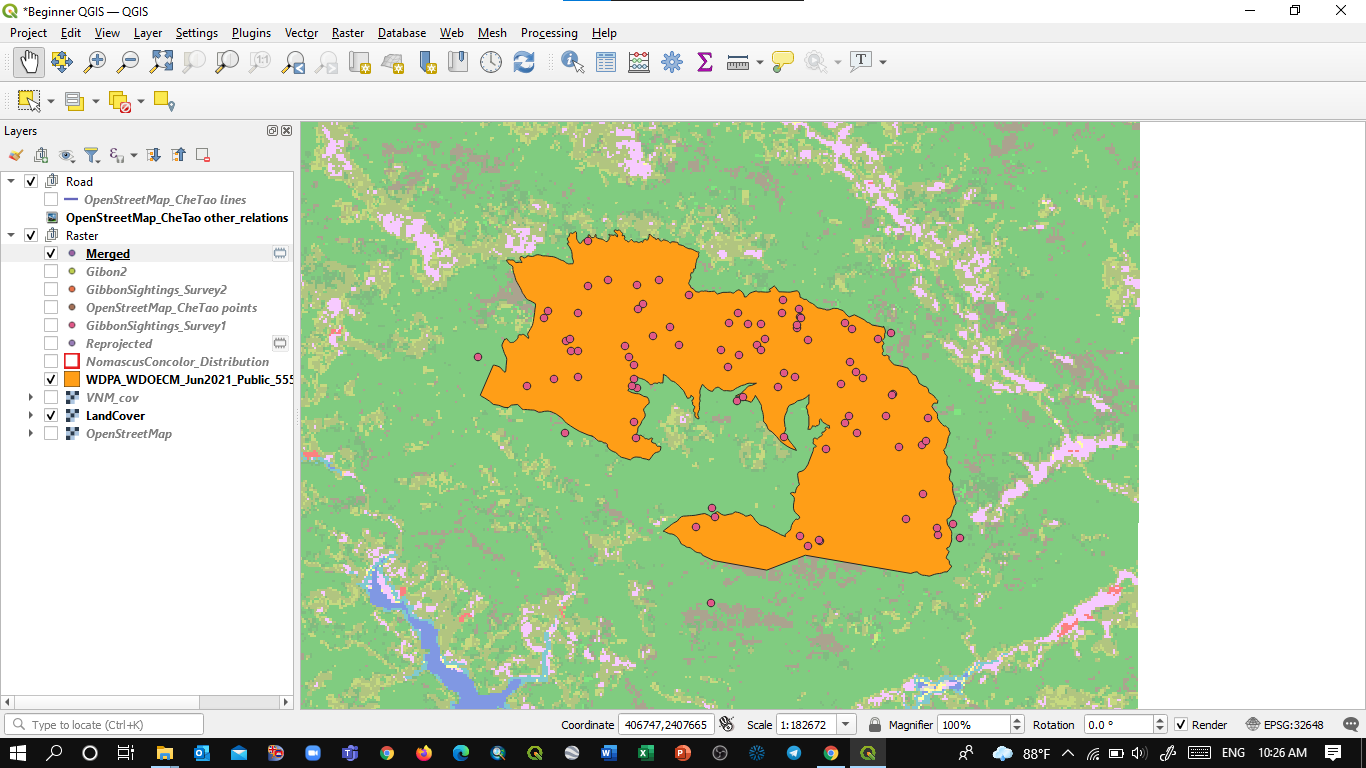
Hi Sulemani! Good job with your work!  It can be quite frustrating if there is too much information at once, I know. But still, I have a question about GibbonSightings_Survey2 points. I’m not sure if they are visible on your map or maybe they’re under another layer. Maybe you can check that out? And another comment… Try playing around with colors so the points are more visible in the background.
1 Like
Thanks so much @Victor This was very helpful and that link I will keep handy for future reference.
Many Thanks.
1 Like
Happy to help @Zaynabou 
So this module was particularly challenging to me as a beginner. Many of these terms are brand new to me, so I had to make sure to keep notes to keep them straight. I also for whatever reason was unable to save a new layer for the second survey that included EPSG in the name - it kept giving me an error code. However, I went through the steps anyway and still got what appeared to be the correct attributes table and map. I got a deep satisfaction from completing this module as it is very uplifting to learn, study, and then use these terms that I had no previous knowledge of and incorporate them into something readable and presentable. This is helping my progress towards my learning goal of understanding how to use GIS and to have the ability to use it for future projects.
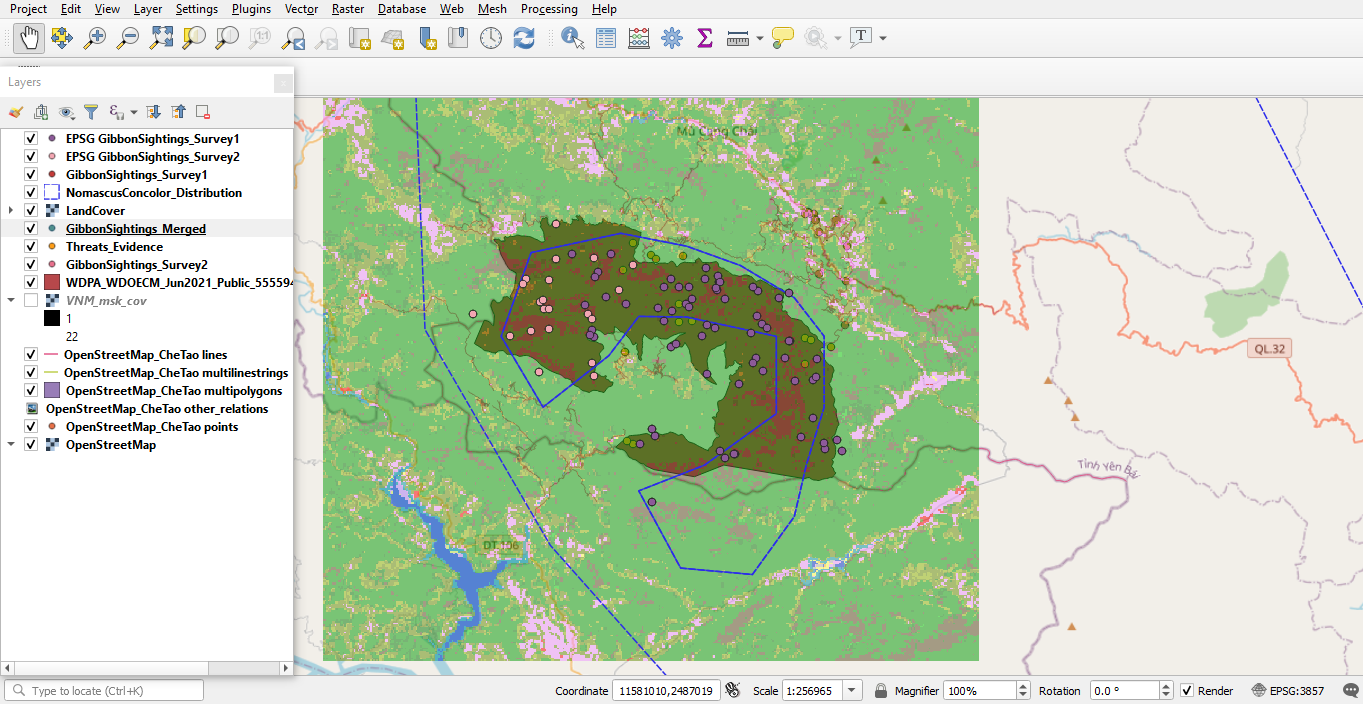
I love the visibility of your merged data! After looking at the order of your layers, I was able to play around with mine and switch it from the grayscale to the more natural look, although I do understand the pros of both. Your original data (the gibbon sightings and threat evidence) seem to blend in with your chosen range color, is that on purpose to highlight the main point of this module?
its being so great particpate on that formation and learn so much, im descovering new tools on GIS and lern so much with the others comments, i have some doubts but its going well i think, on this module i think im litle lost but im madeing a refresh to understand better.
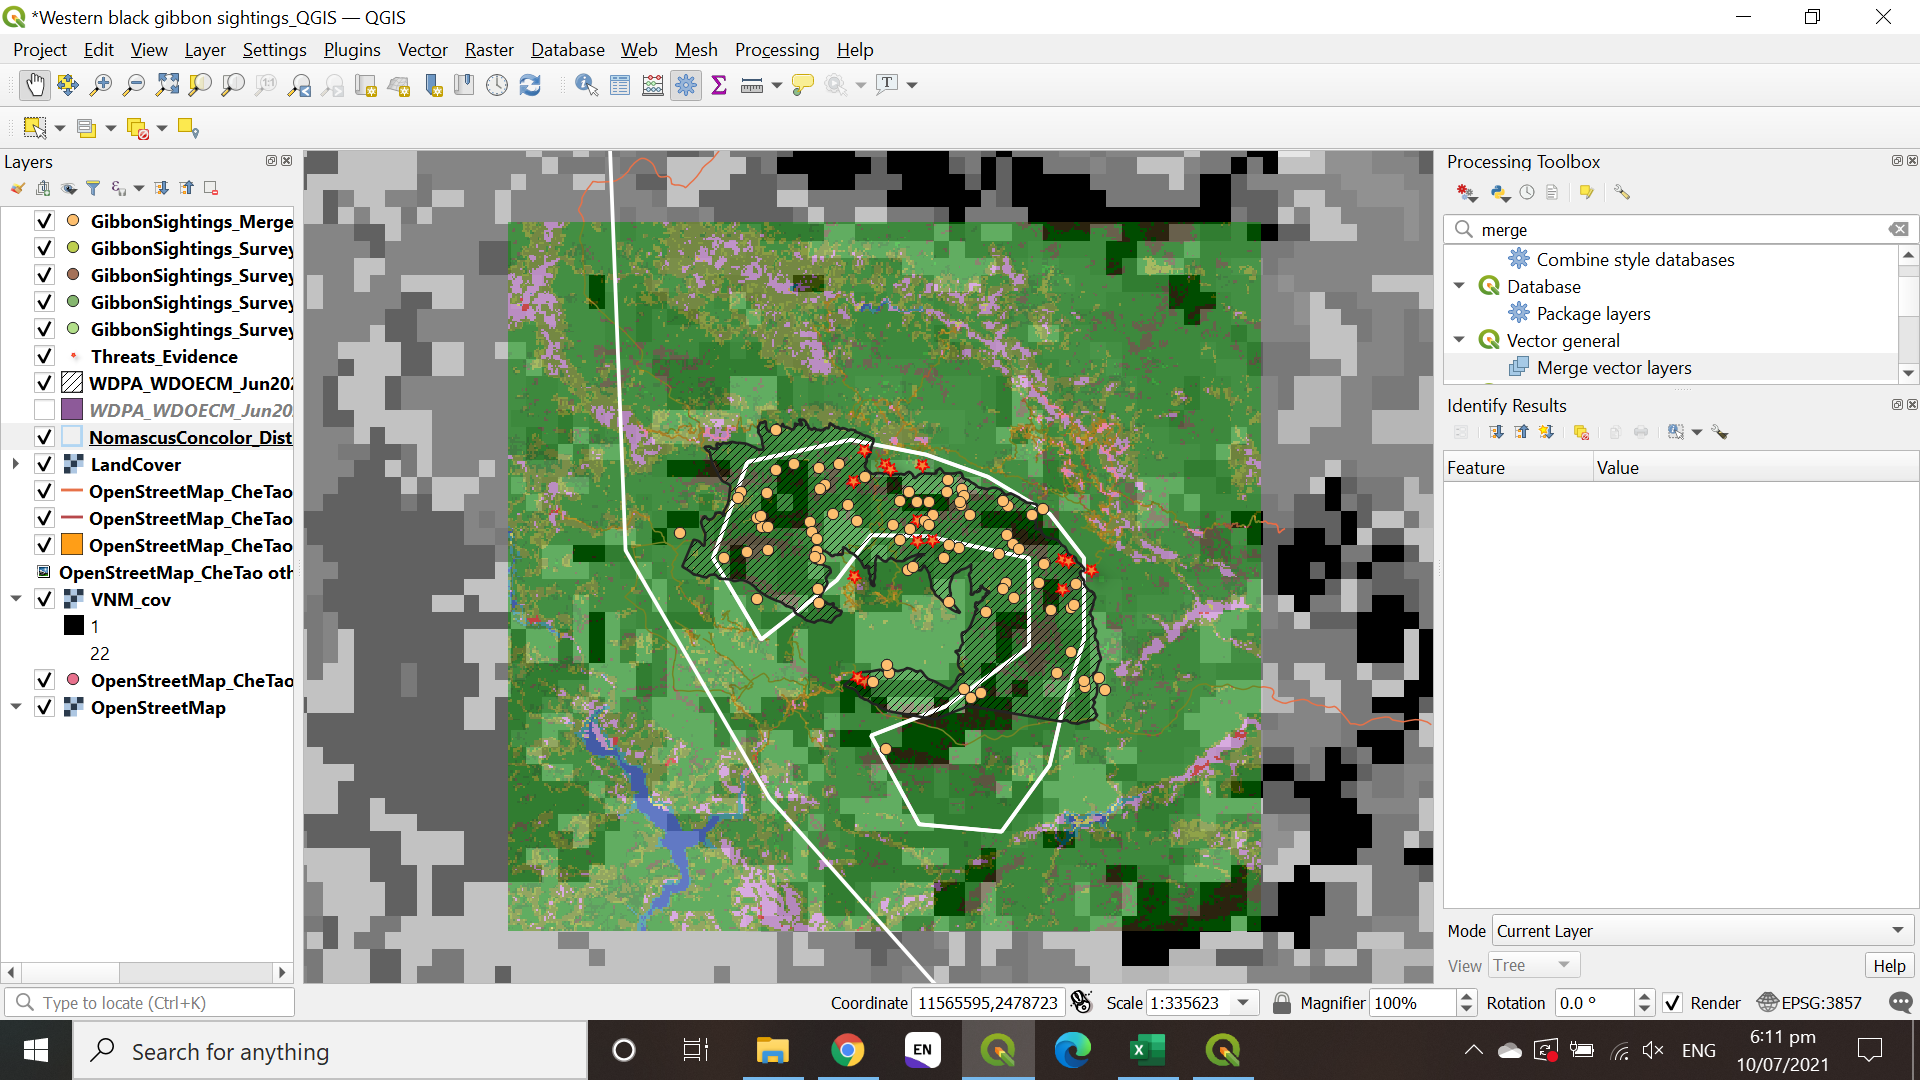
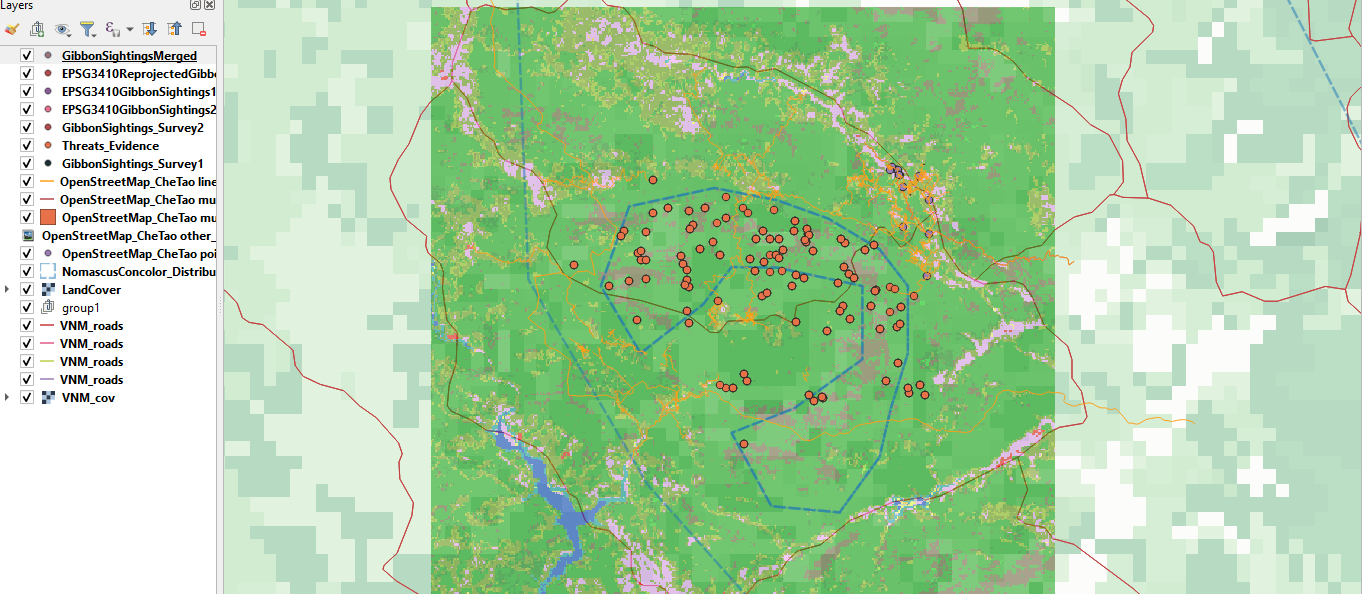
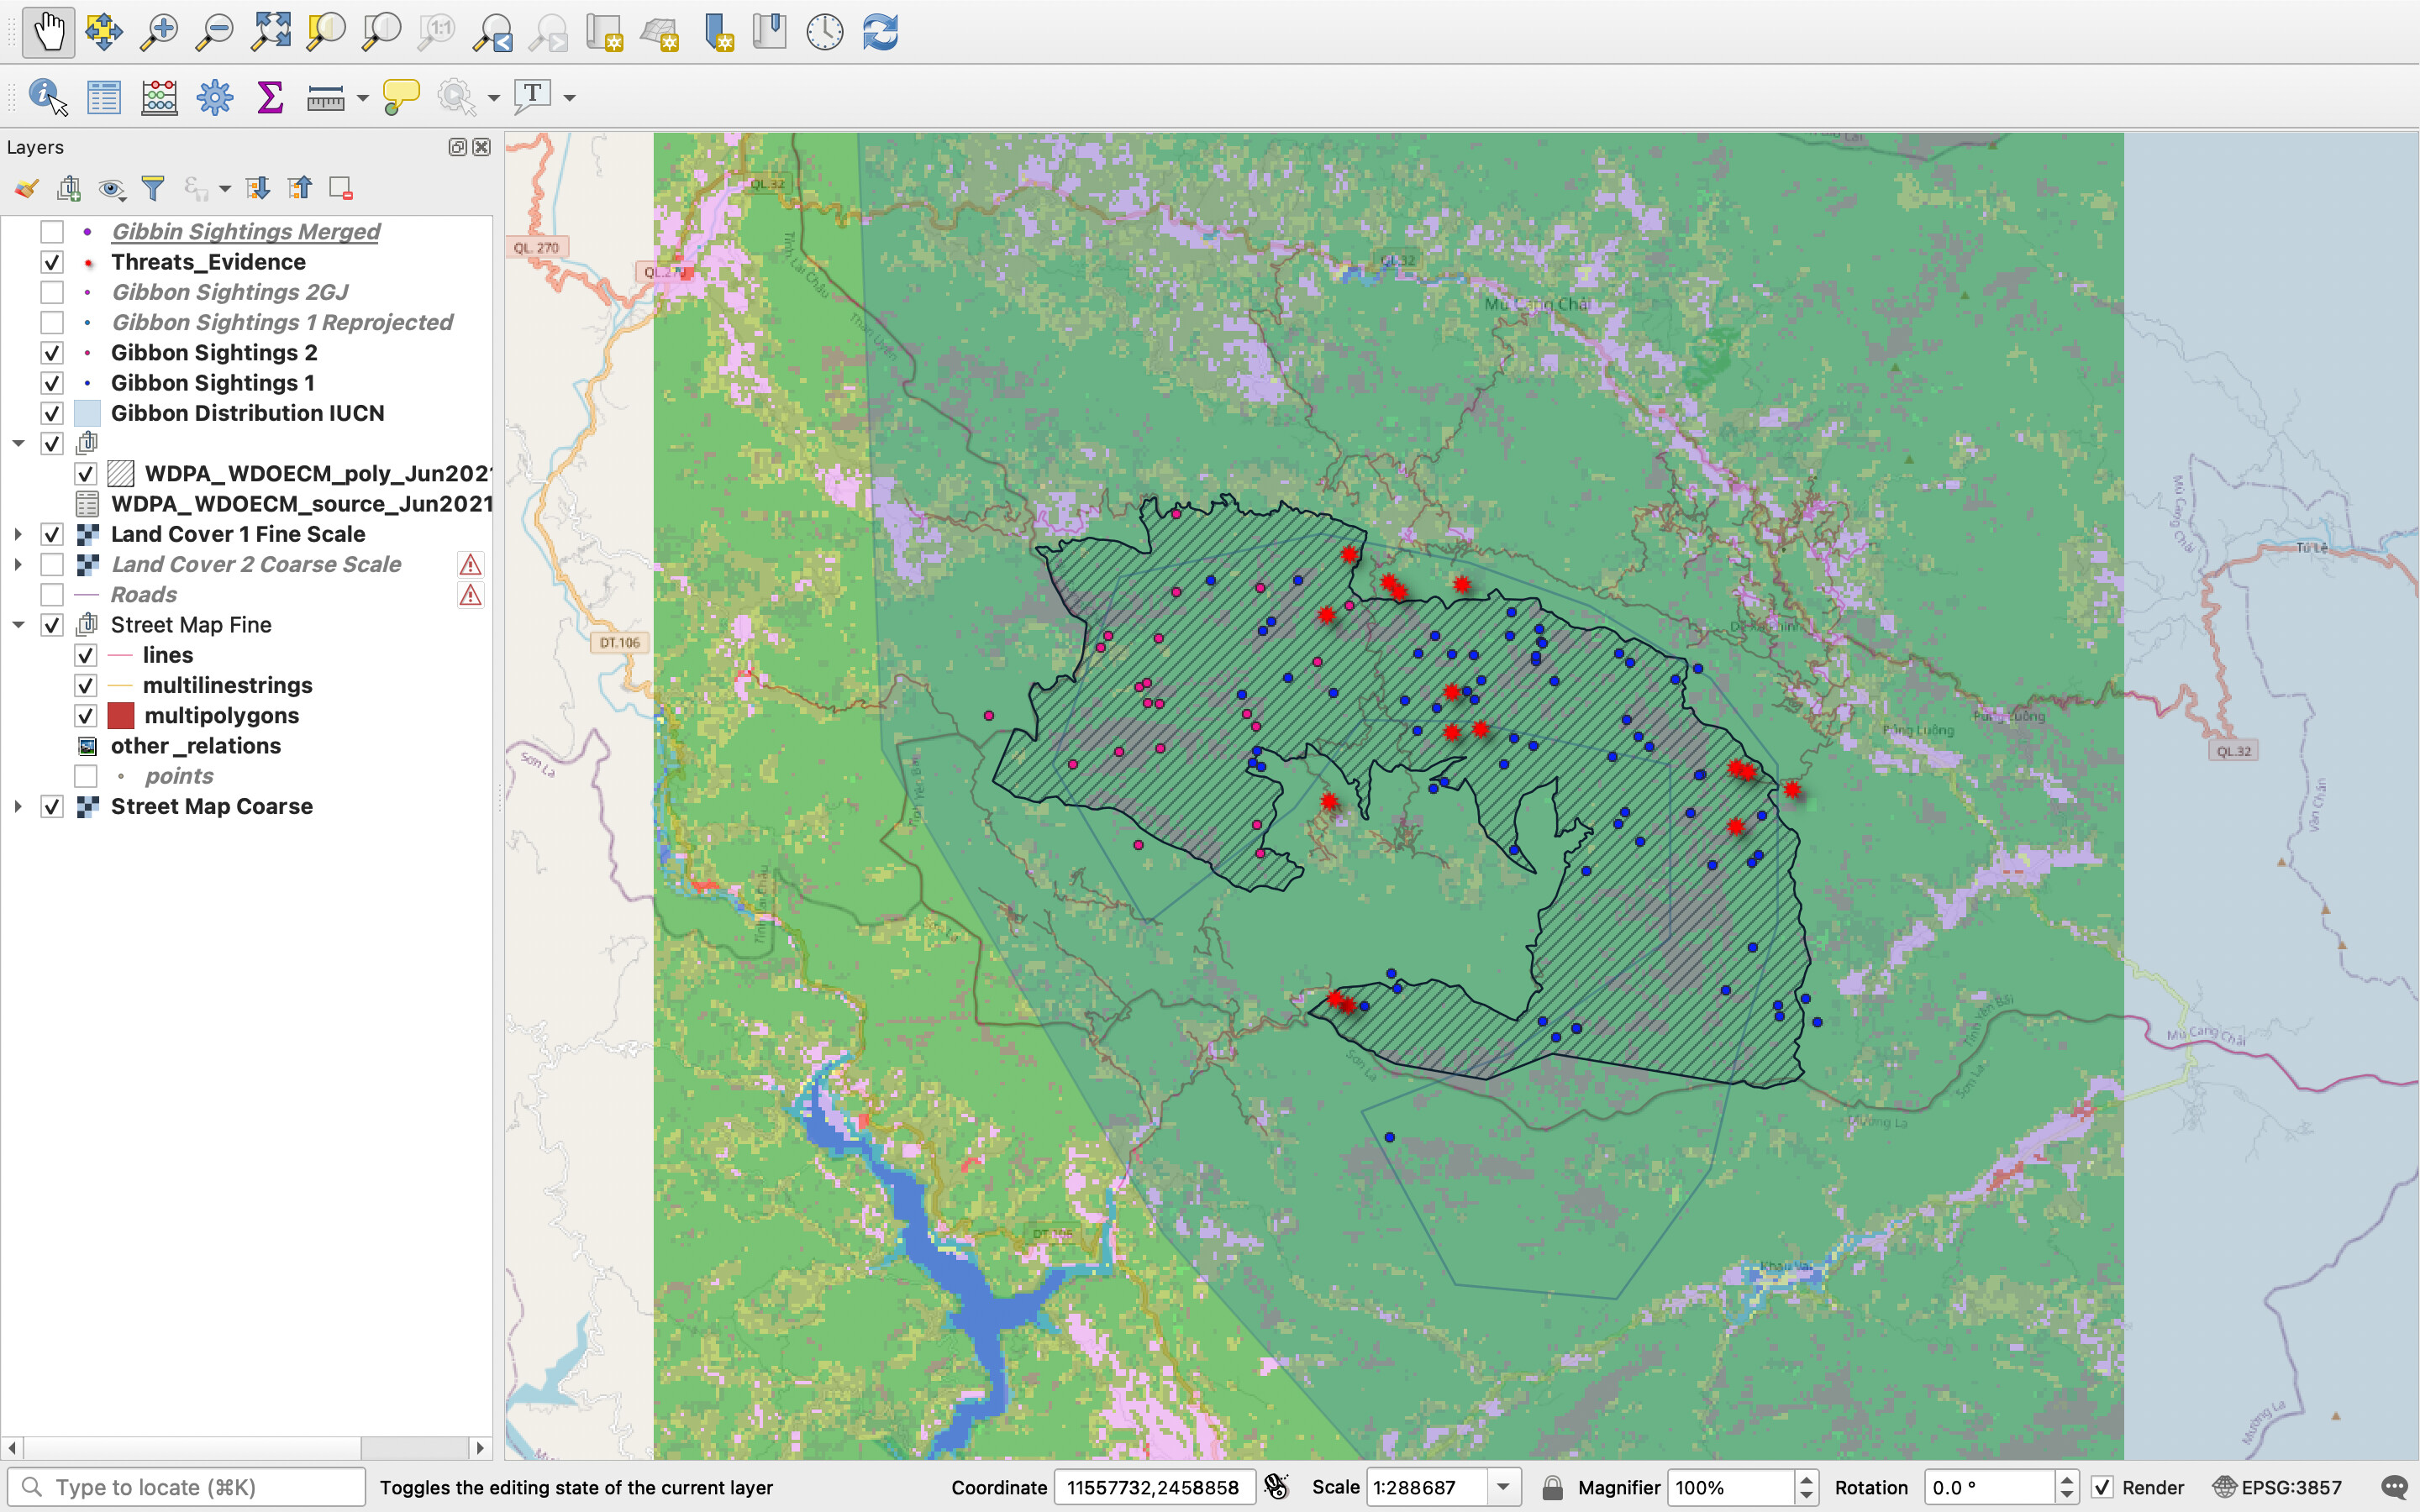
Learning more about spatial referencing has been really useful especially as I have spatial vector data saved in a variety of different SRS from the field sites where I work. It has been really useful to learn that it is possible to merge layers into the same SRS within QGIS after having previously used formulae to try and convert things within excel into longitude/latitude and this has been complex at times. When it came to merging the survey 1 and survey 2 gibbon data files I confused myself for a while thinking I had not done it correctly as on my map I could only see the changed colour of the survey 2 points, however when checking the data table it did have all 88 records, it was not until later that I realised this was due to the order of the different files I had in the window and with some being selected and above the merged file only the survey 2 points showed below. I chose to put the threat locations as a different shape to help separate them from the gibbon sightings and I thought about contrast of colours on the map if it was to be produced in grey scale - I can still improve on this.
1 Like
Hello.
You have produced a very clear and easy to interpret map which is really good, well done. I like your different used of colour and grey scale. I agree that this module was really good for exploring more about layering and the different options QGIS has to help us show our data in the most spproporaite way.
I had trouble opening all of the Open Street Map files and looking at several of the images displayed here, including this one, see that my map is missing the OpenStreetMap_CheTao points
Hi all
I found this module harder than the last two. I am still wrapping my head around how the different SRS work. I also had trouble converting my .csv to a .geojson but managed to work it out in the end. I think understanding what type of data you are recording and how that needs to be managed in GIS is an important step in my goal of understanding the basics of GIS.
Hi Francesca
I like your choice of contrasting colours! I also decided to use a different shape to distinguish the threats from the gibbon sightings. Thank you for the It’s good idea to keep in mind what the maps would look like in grey scale. Something else I thought about after seeing your post was to use colours that would be easier to distinguish for someone with colourblindness (or perhaps to utilise more shapes).
sorry i think i was replying @Ler but somehow replied on your post. my bad!
This was quite a challenging module for me. I had to redo everything several times but hey! I’m slowly grasping it! I had trouble understanding it since I’m so slow. But a consistent practice and repetition of practice in activity helps!
I’m getting better in understanding it as I get a better picture on what I might can do with my study.
A job well done! Your map looks good to me. I realized I did some mistakes when I compared my works with others. This module was definitely not an easy one. It took me several practices to finally grasp it since I’m so slow. Keep practicing things then we’ll get there!
1 Like
This week I`ve learned some more theory behind geographic and projected reference systems and that was useful for me. Also merging layers was usefuld and I will probably use this oepratiuon again in the future.
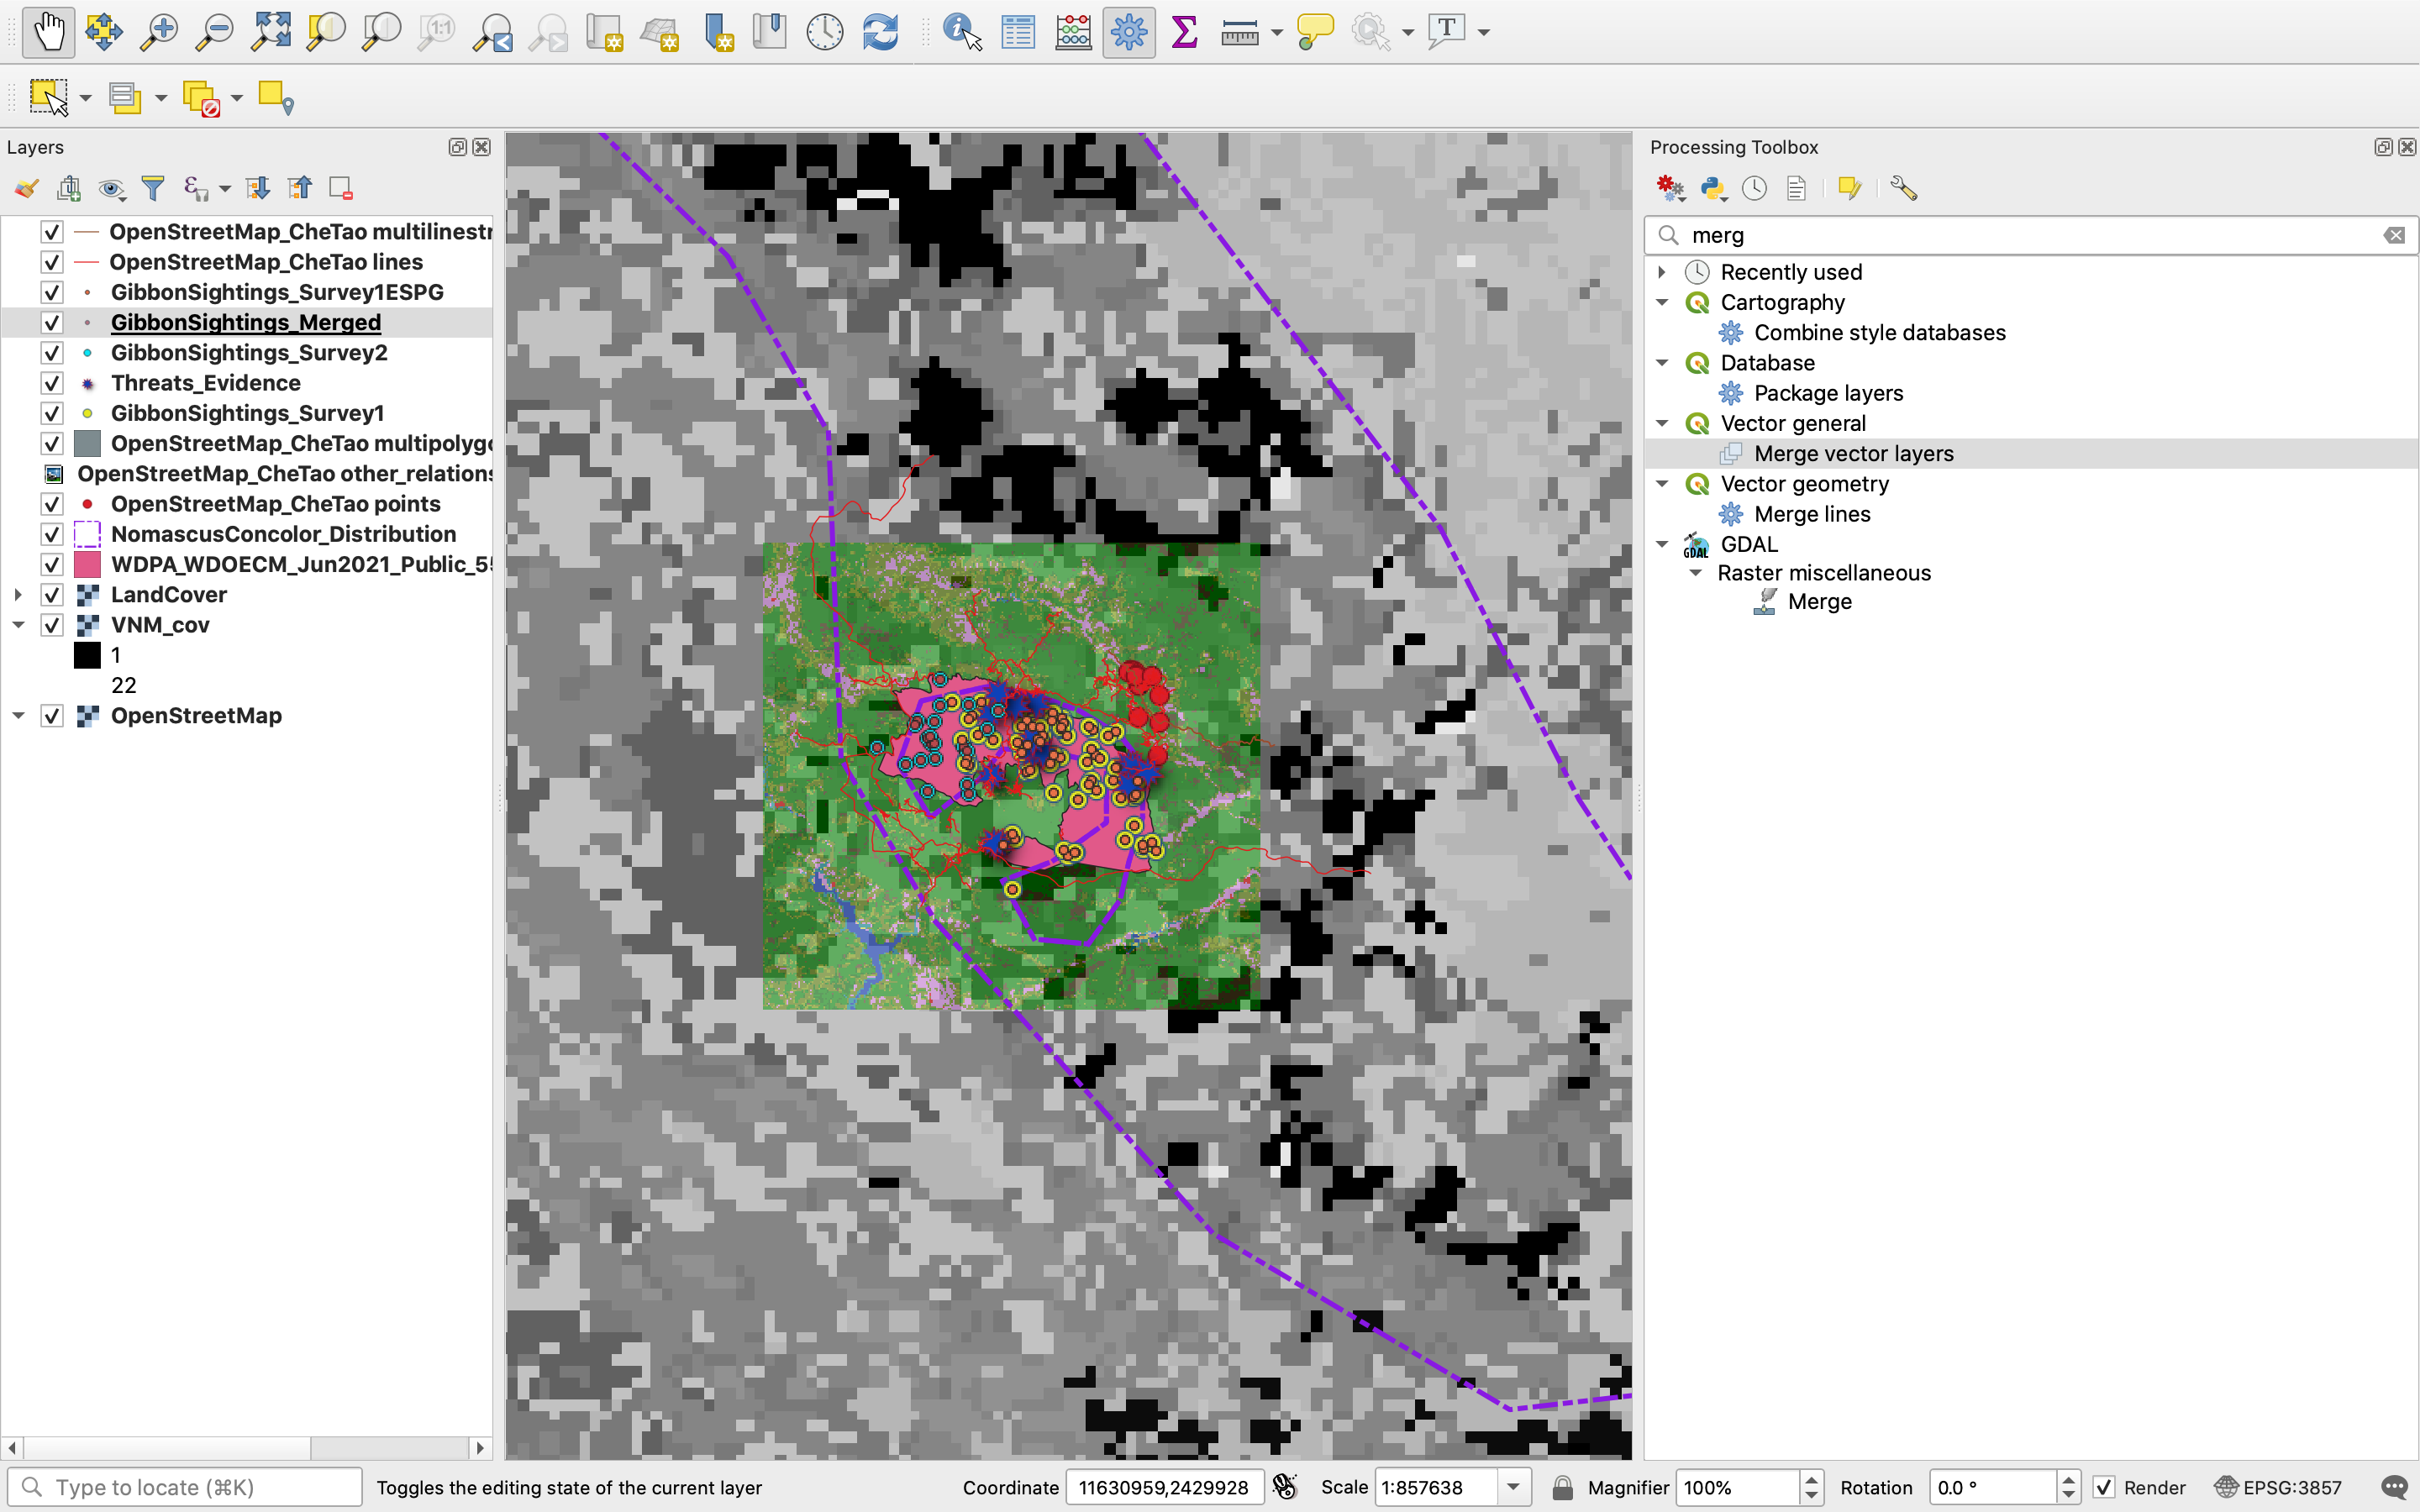
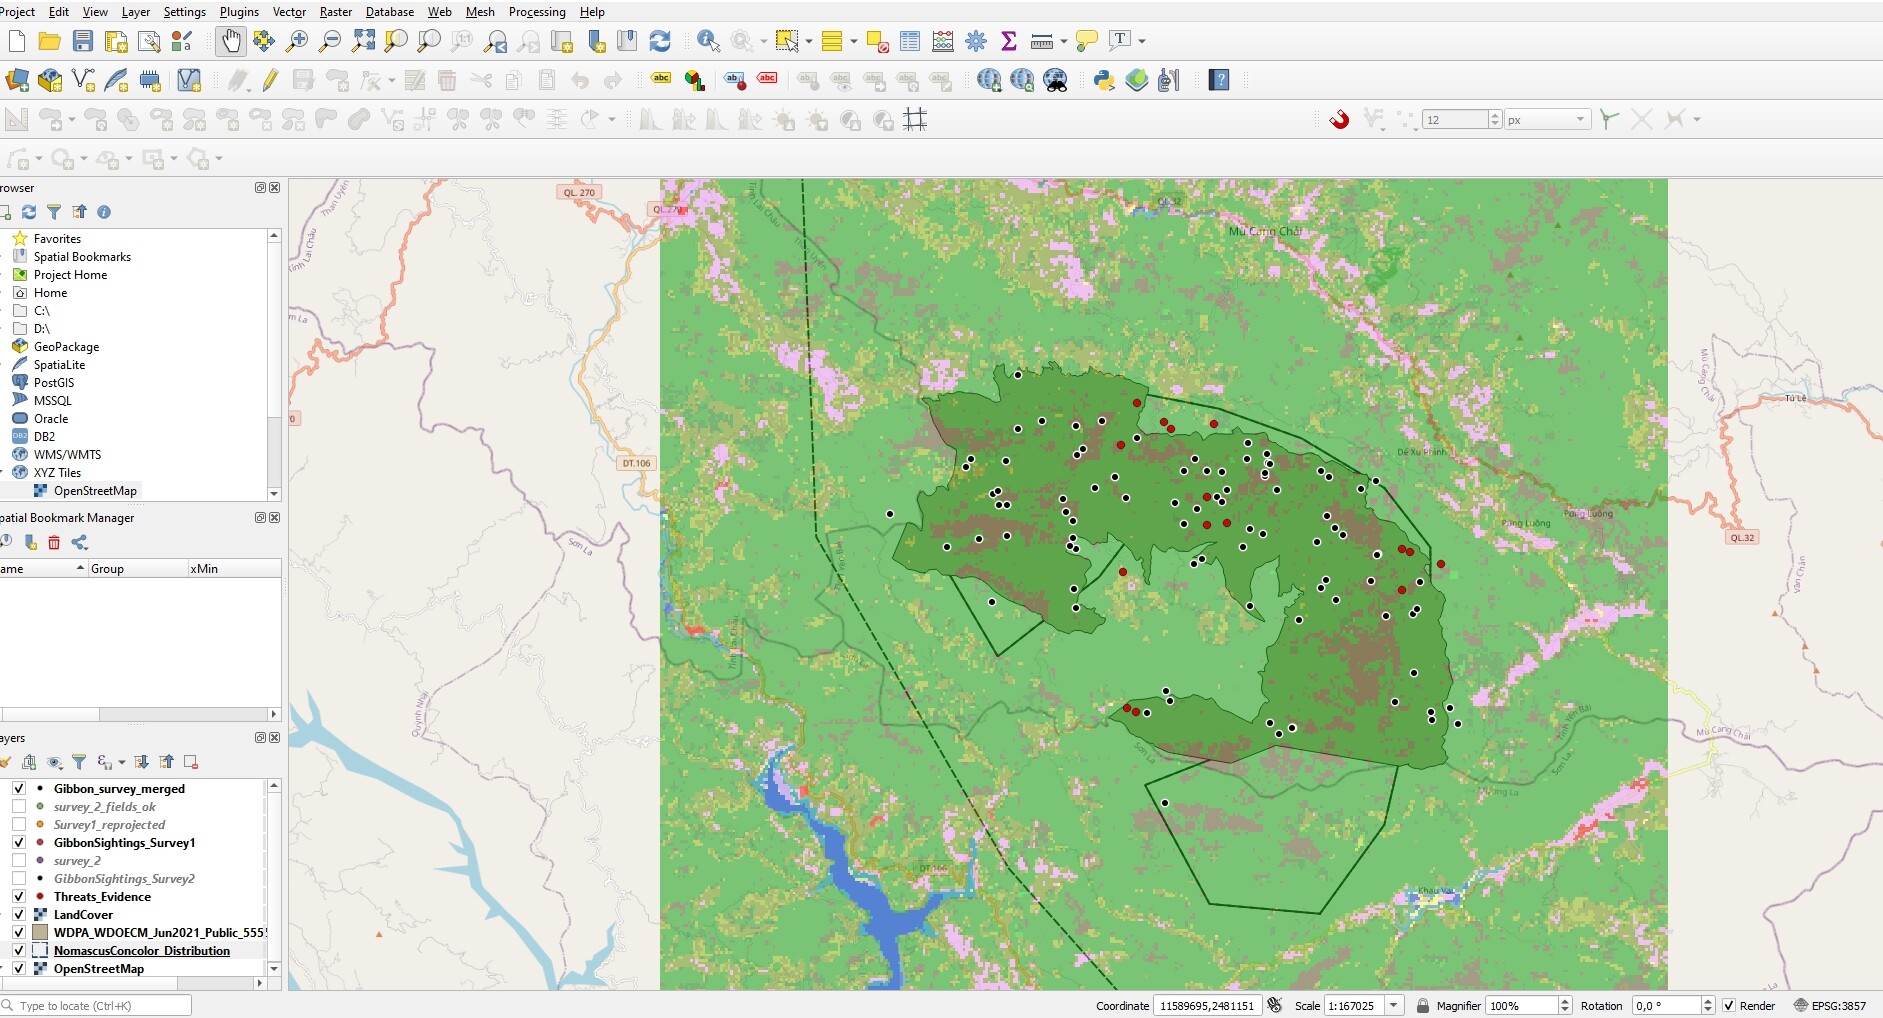
The problem I encountered was that the merge algorithm did not work initially, It gave an error message that survey_2 had text data type in some fields instead of numbers. I did some research and found out that I needed to change the data type form inside the attribute table using refactor from the processing toolbar.
The result is my map v3 that has the presence data merged in a single layer and the threats.
Hi,
Nice map. Don`t be afraid of deleting layers form the layers panel, they will still be available on your disk. Also if you want to mess around with a certain layer. right click on it and select duplicate layer. Then you can experiment on that copy.
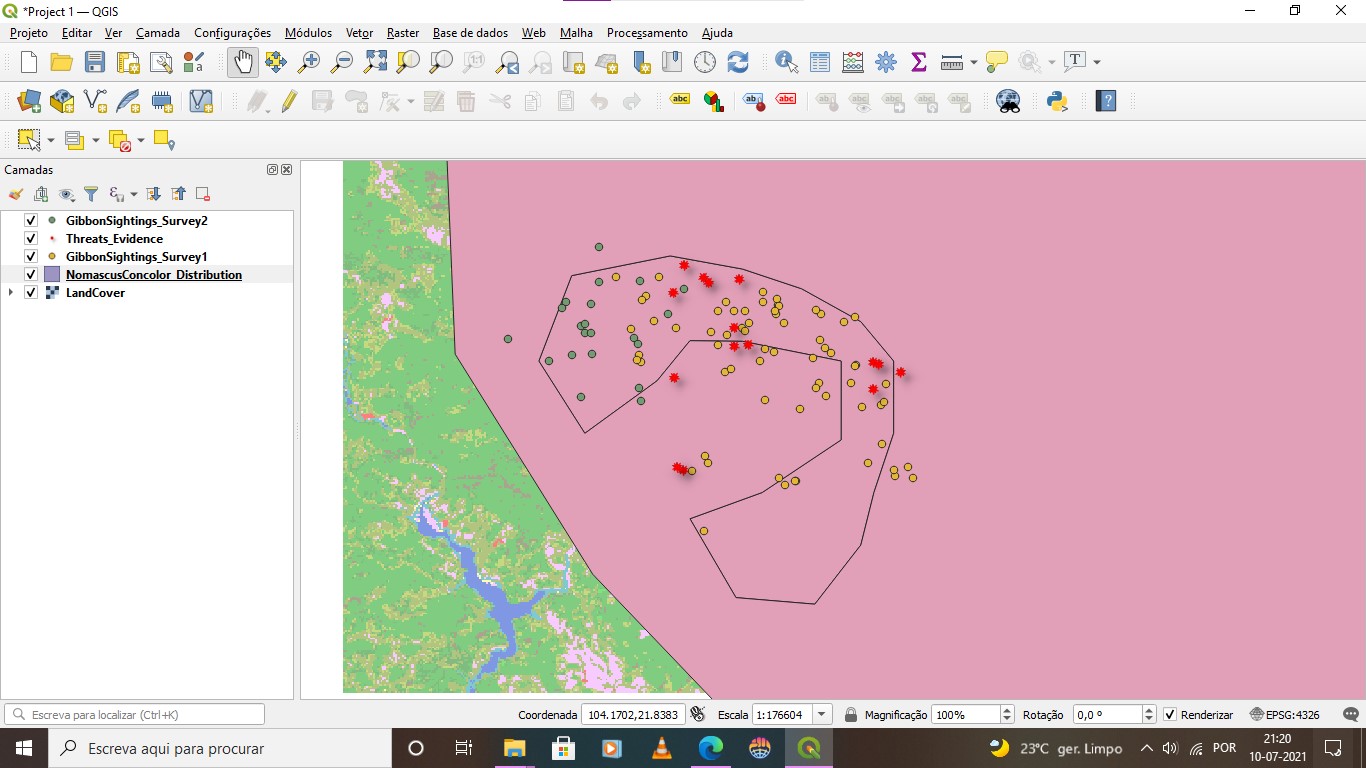
I liked that you used two different colors for occurrence data and threats, which I also implemented in my map.
Cheers!