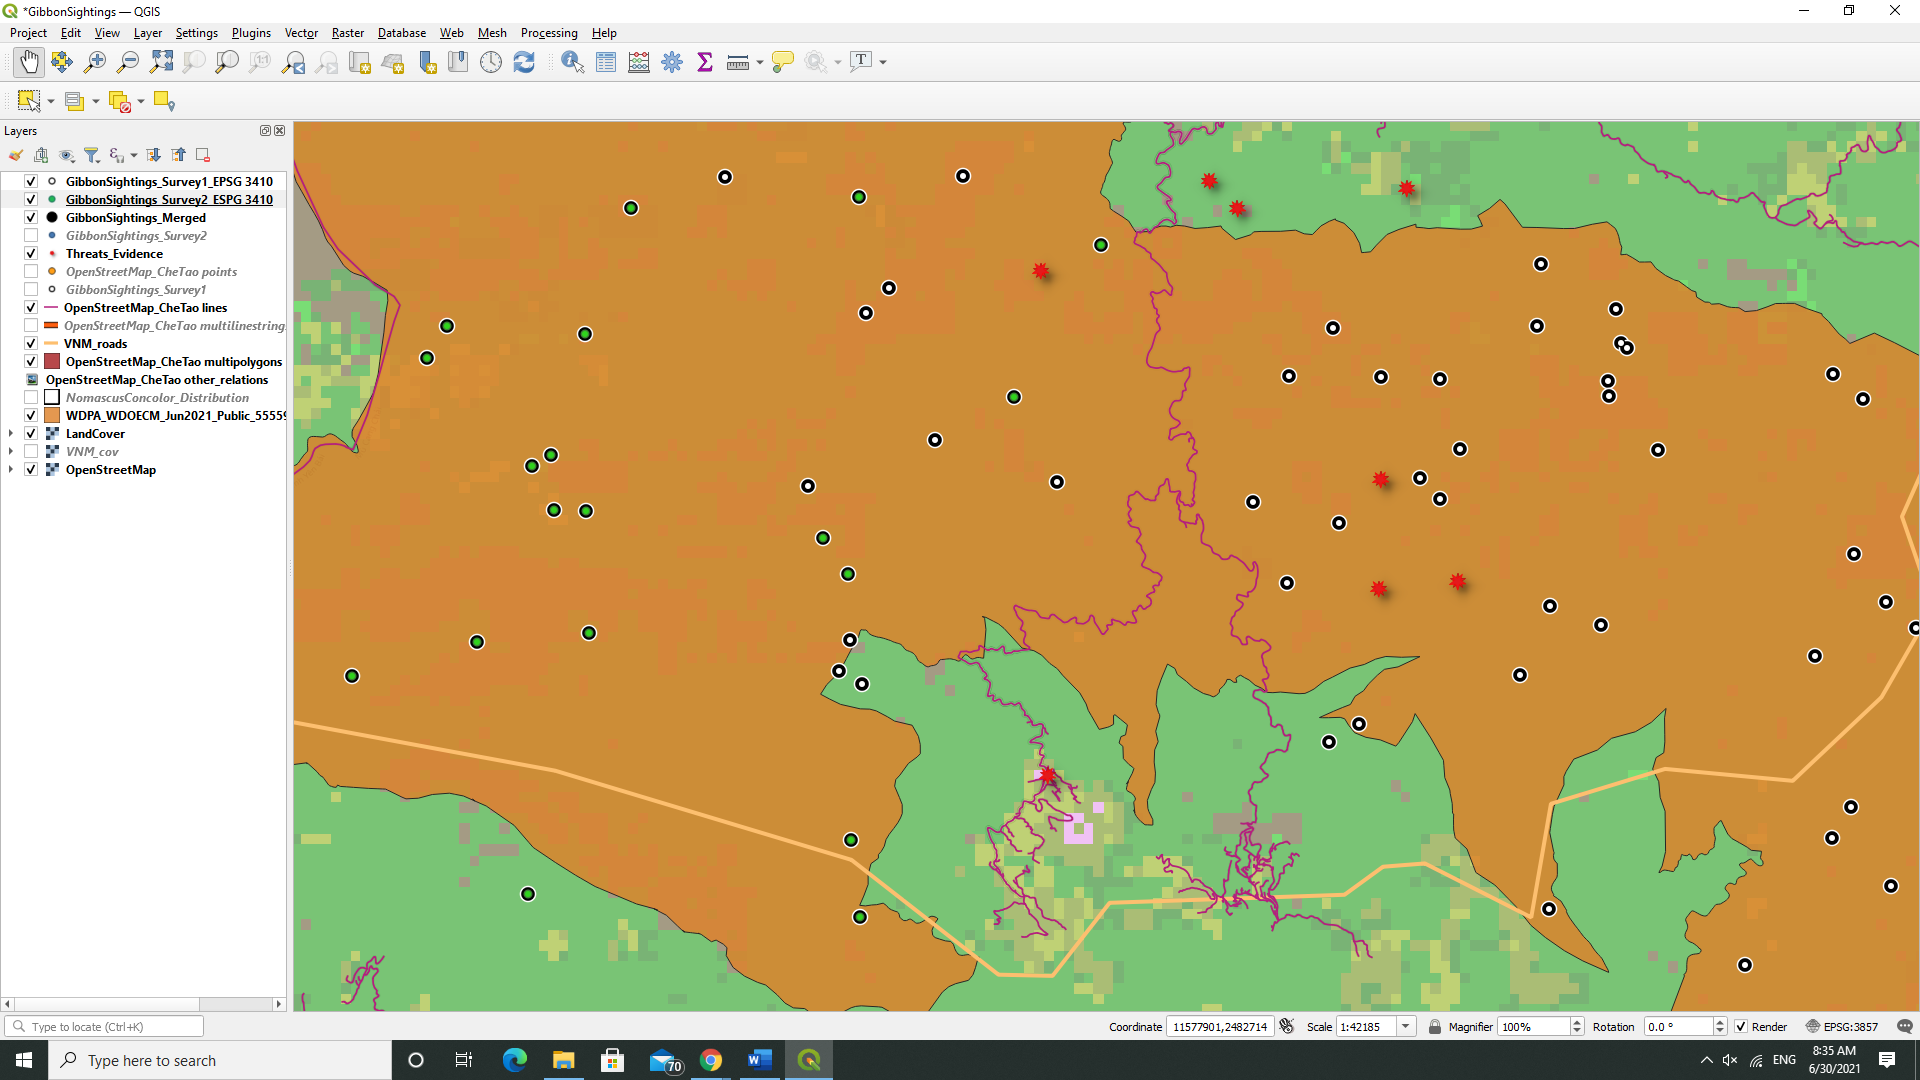
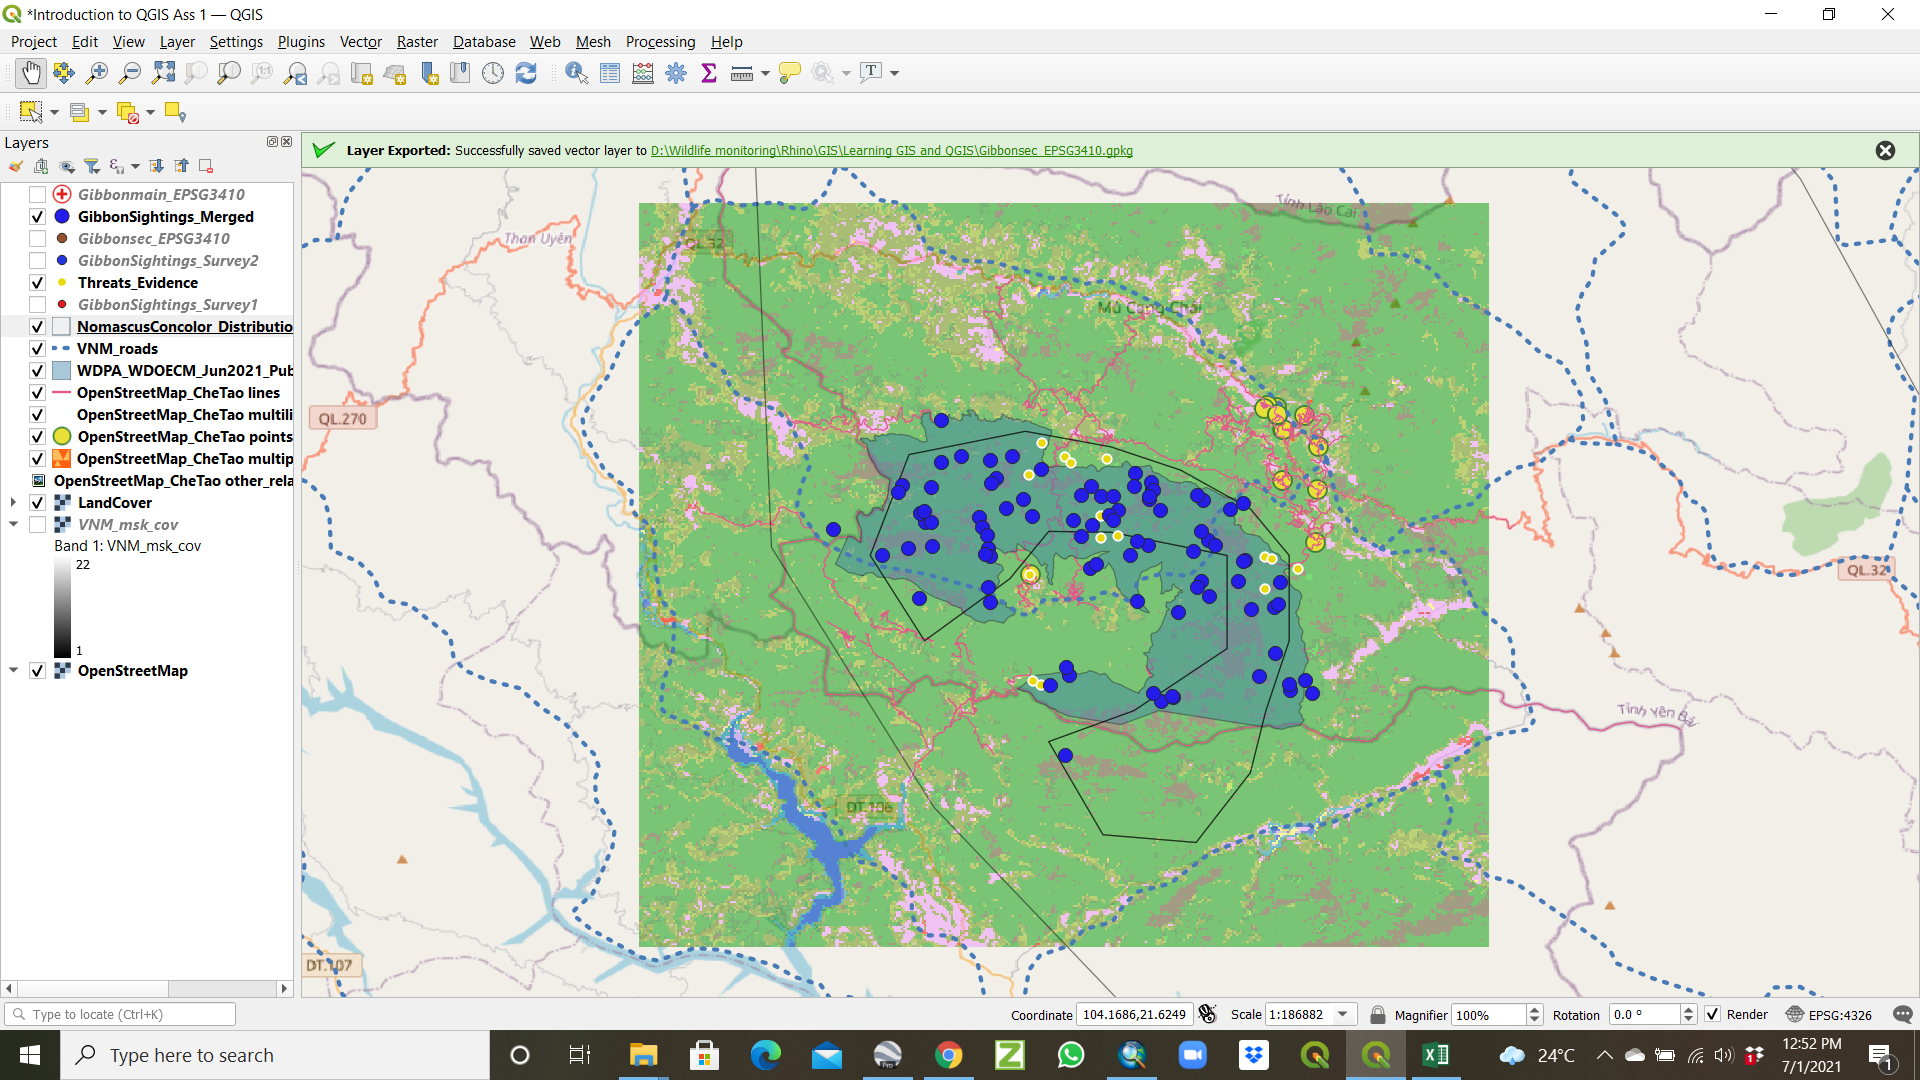
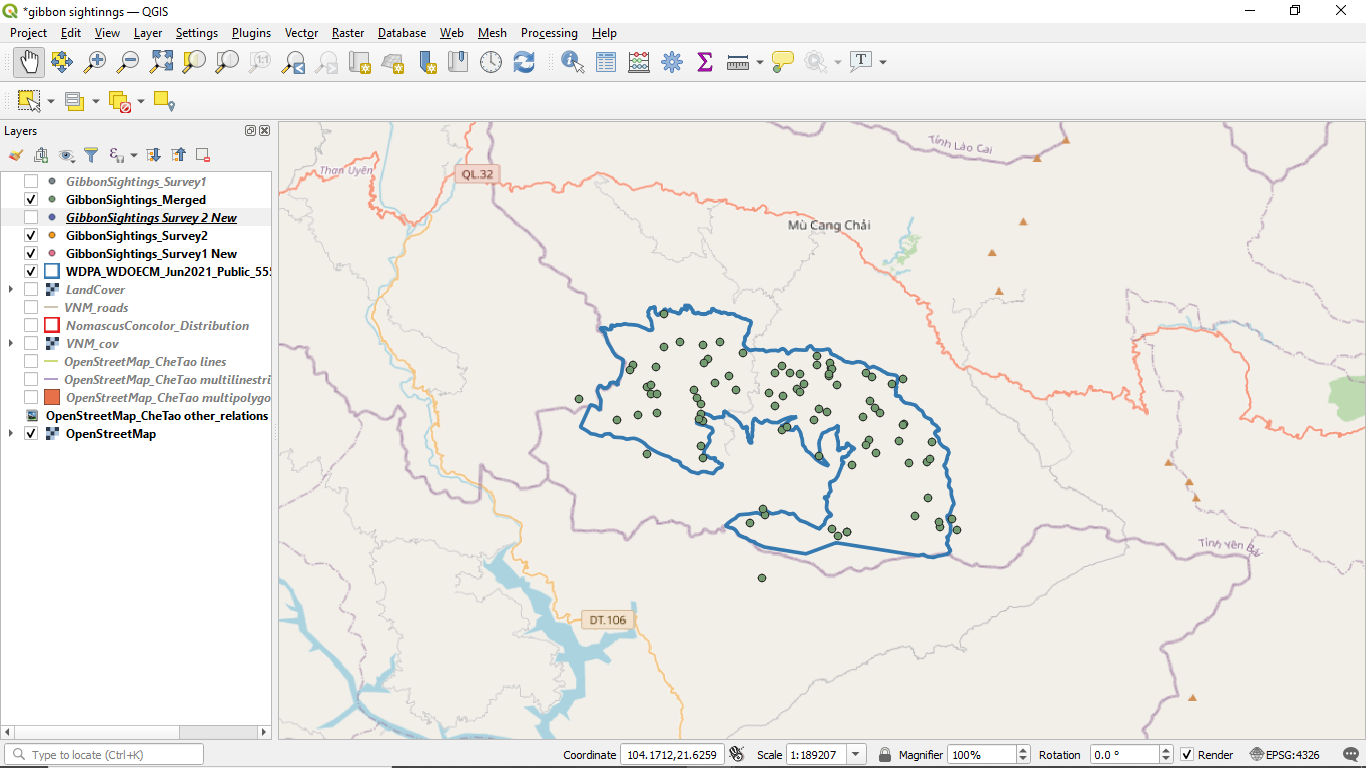
Thanks for pointing that out. It looked different on my computer but when I compared it with my screenshot submission, I can see what you mean. Here is a re-submission of the same assignment with a different color scheme.
Hello everyone
I have learned a lot from SRS/CRS module.
- How to creat CSV file and adding into a layer.
- Identified SPS/CRS used in our Ethiopian wolf monitoring field,i.e UTM zone 37N/ WGS 84 EPSG 32637.
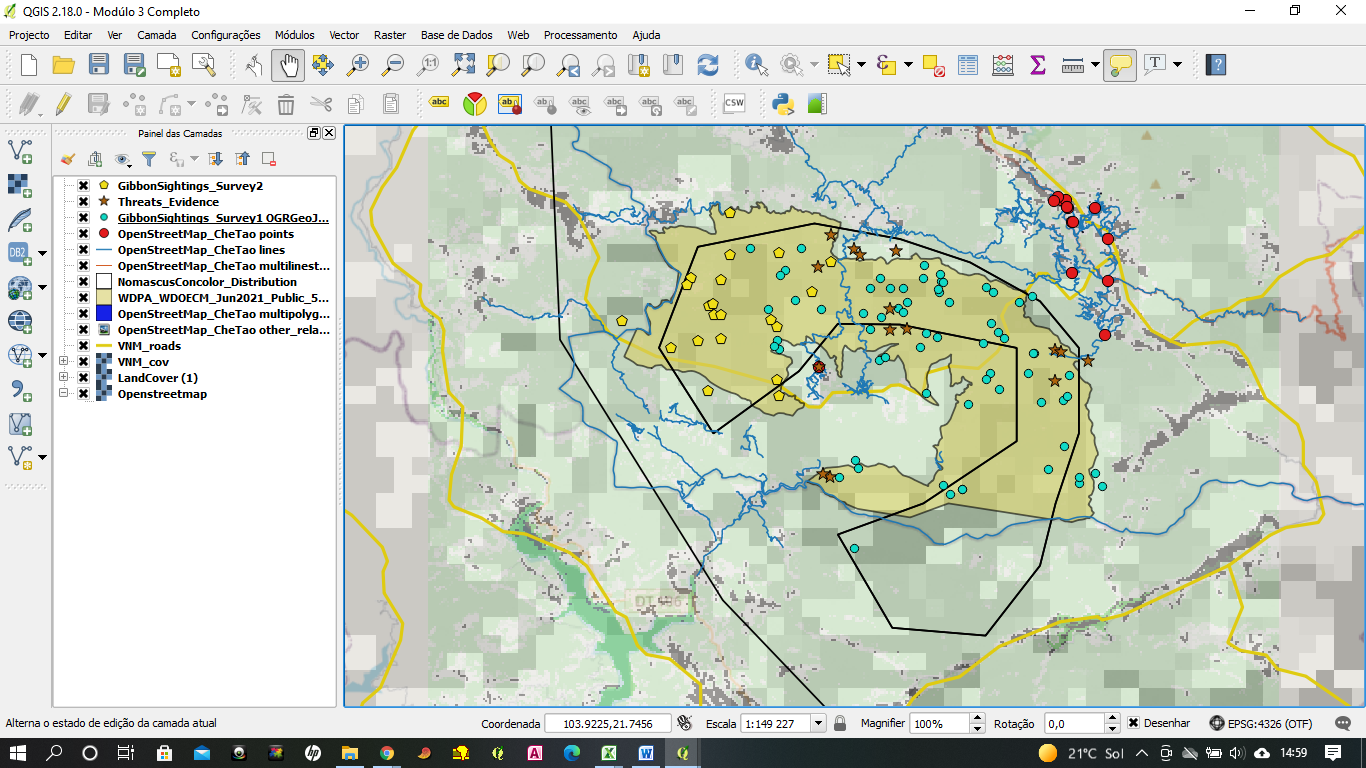
I have been using QGIS 2.6.1, because of my personal computer problem. The problem that have been faced; I did not found XYZ layer in the QGIS 2.6.1 of first module and I did not add Open StreetMap, currently my Pc fixed and using QGIS 3.16 LTR in right way that have seen in the screenshot.
2 Likes
Hi!!
That looks great! Very clear. About your problem, I didn’t happen to me but it has happened while doing something else but restarting QGIS it worked for me. Did you try it? did it fixed?
Greetings!!!
I enjoyed this module
 I found it straight forward and I am definitely feeling more comfortable with the software the more I use it, which is the main thing I want to get out of this course! I didn’t encounter any issues this week.
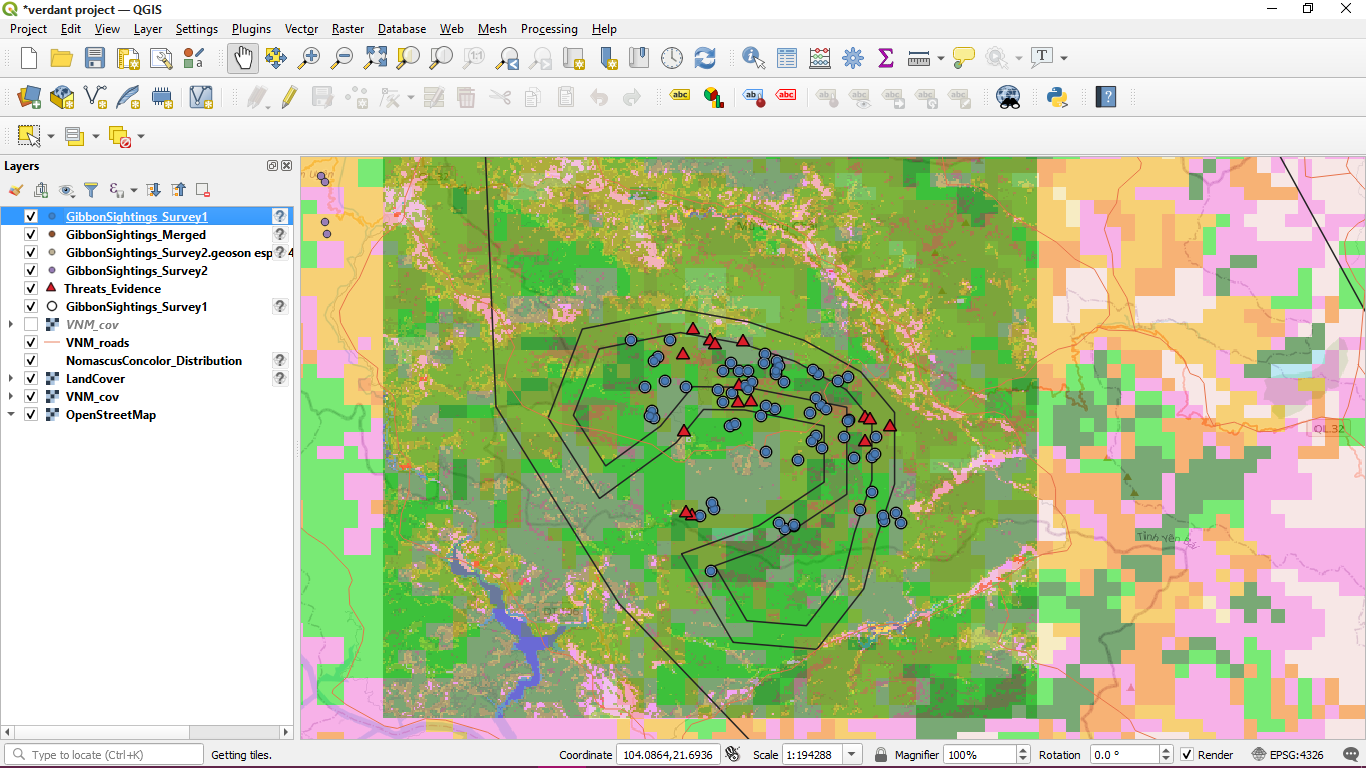
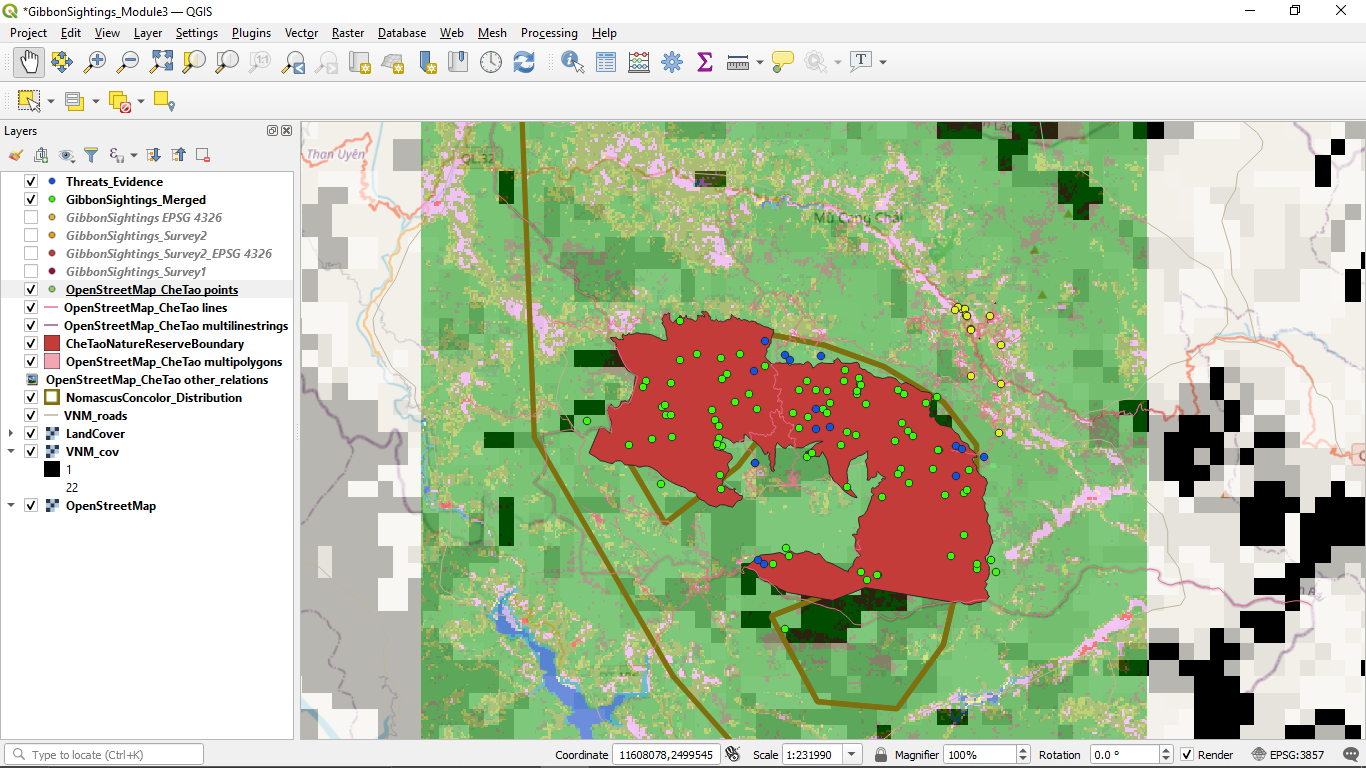
Looks good! I think you are just missing the nature reserve boundary? and maybe could make your points colours that stand out a bit more against the map (that’s my favourite part!  )
)
Great that you’re getting comfortable with the software again! The only feedback I would have is maybe play around with the order your layers are in, and their transparency (especially for the maps and borders) - I’ve found playing around helps get used to where everything is, and helps you to find the most optimal visual display of your data
Hello,
I hadn’t tried restarding QGIS but it was worth a try. Unfortunately, it did not work. Thanks though!
no nothing of such. i will suggest you try following the steps again
This lesson has been so insightful. I have learned the difference between geographic coordinate system and projected coordinate system, merging data sets that have different SRS into a single geospatial file with the same SRS.
Instructions in this module were very clear and easy to understand. I will now be able to read more on SRS to get a deer understanding.
1 Like
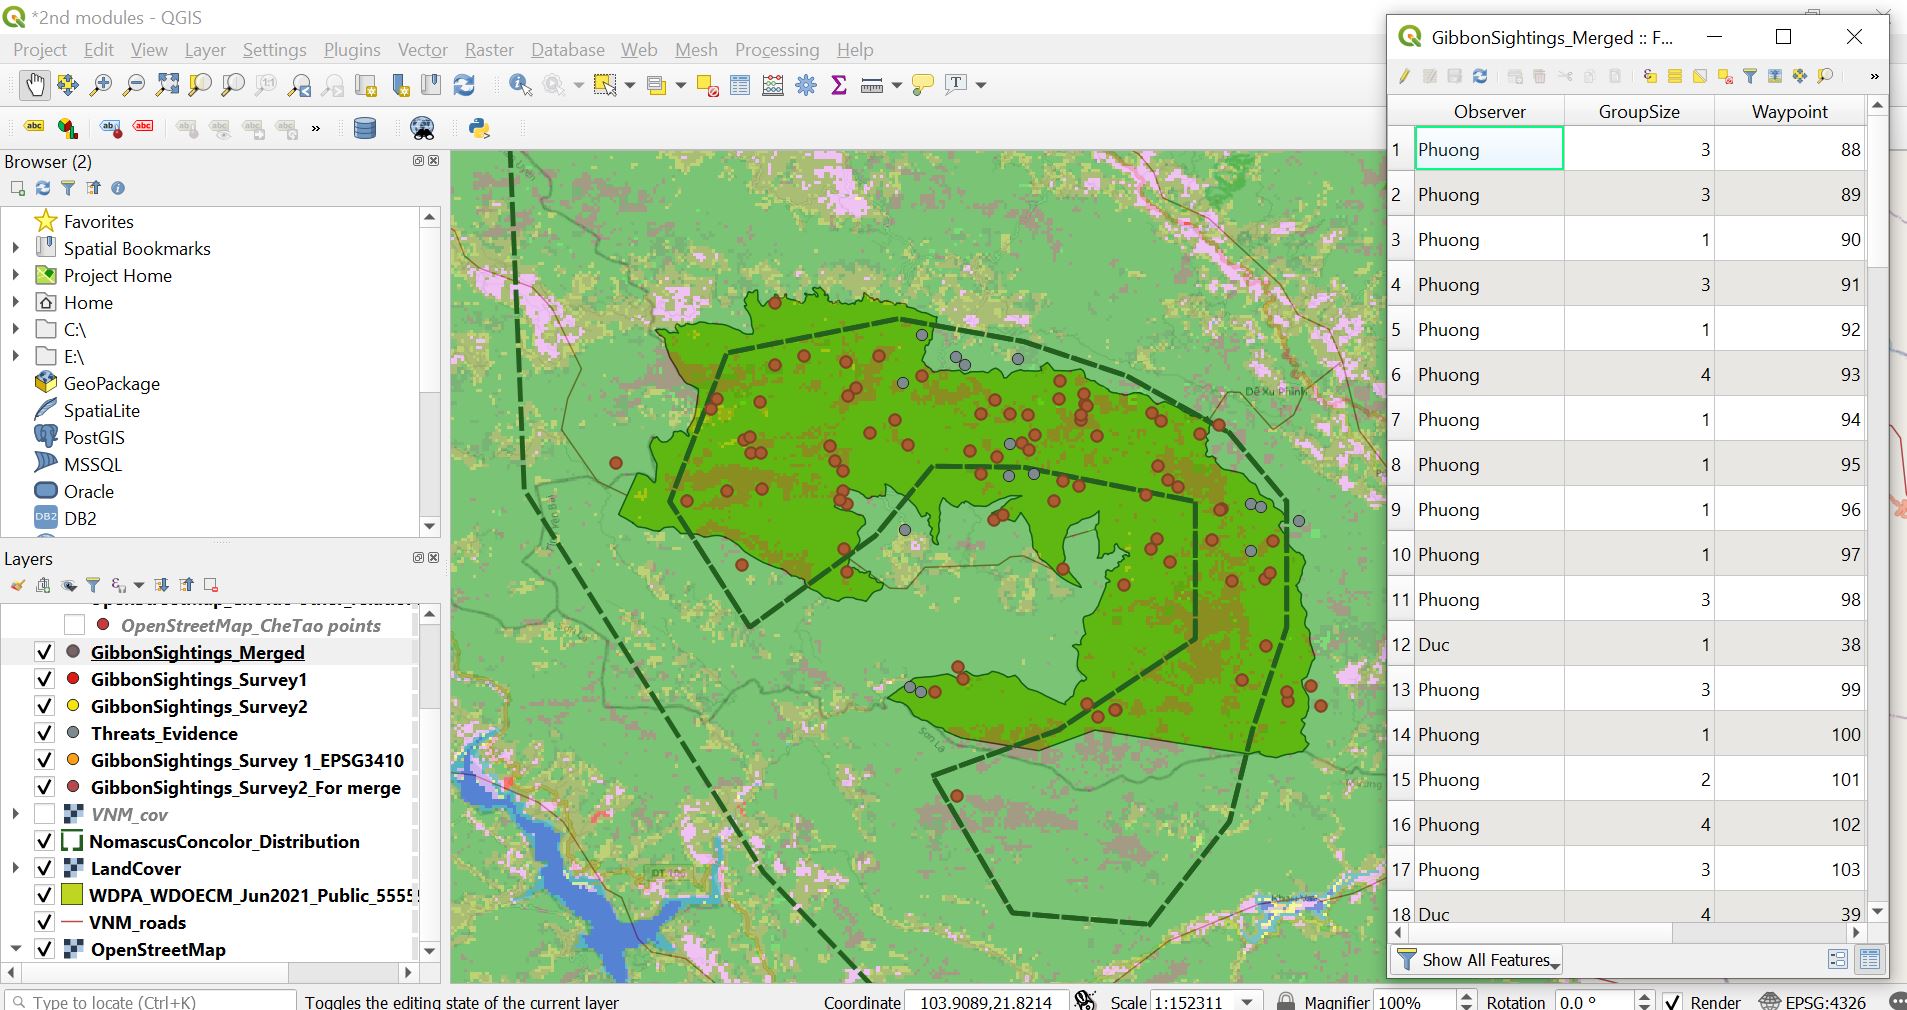
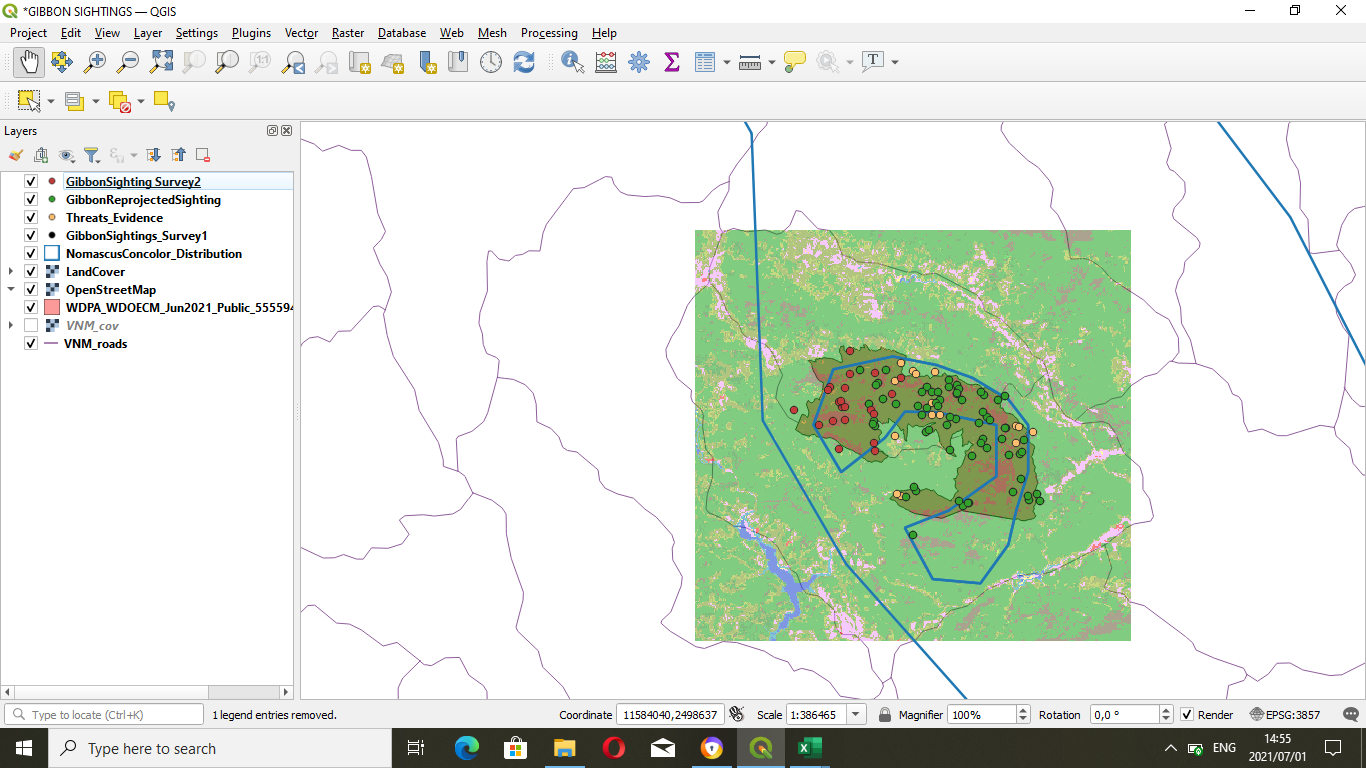
This module was really informative and I have learnt few new terms, like datum, reprojection and so on. It is so excited to know how to merge two separated CSV file into one to illustrate all the sites we have to prevent confusion and it turns to be more easier for the data handling in the future as both of the files are standardized to the same coordinate reference system. As in my screenshot, I was putting the merged file as higher layer than the survey 1 and survey 2 to mask over it, so the color shown wont be so confusing, In case for those who try to differentiate between survey 1 and 2, it can be simply done by unchecking the merged file.
Looks good, gibbon sightings Survey 2 is clear but I think you should have reduced the size of gibbon sightings survey 1 to make threats evidence more visible
1 Like
I think I am now getting an understanding about how I would be able to input my own field data from .csv files (which is starting to feel like slightly more familiar terratory). Along with open source databases.
1 Like
I did this exercise with ease.
I understood why I had to reproject the layer but the process of reprojecting looked more complicated.
Merging the two layers was clear and easy.
I will have to redo this module slowly to really understand.
I was hoping after merging the sightings you will say we remove the old ones from the layer then I remembered am responsible for the look of map. I just turned them off.
Thank you for this Lucy, am Learning a lot.
3 Likes
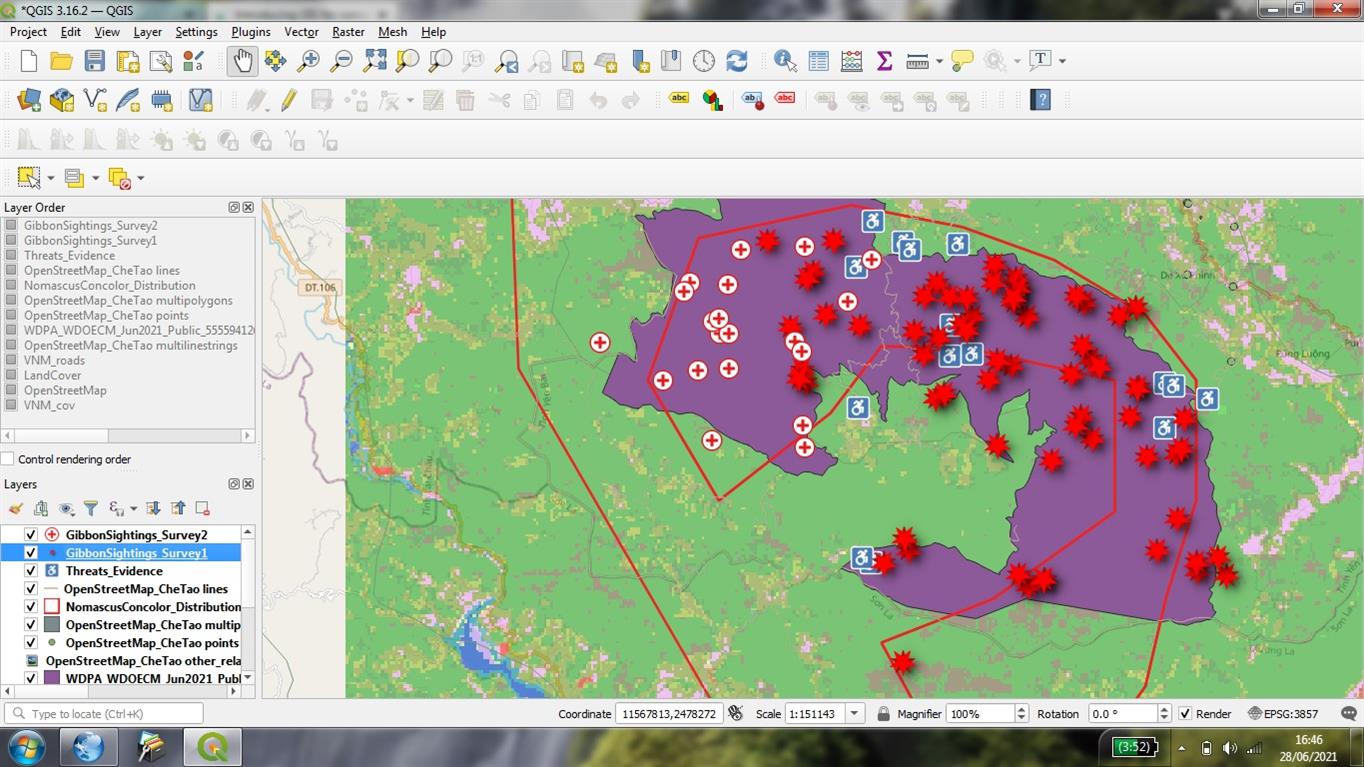
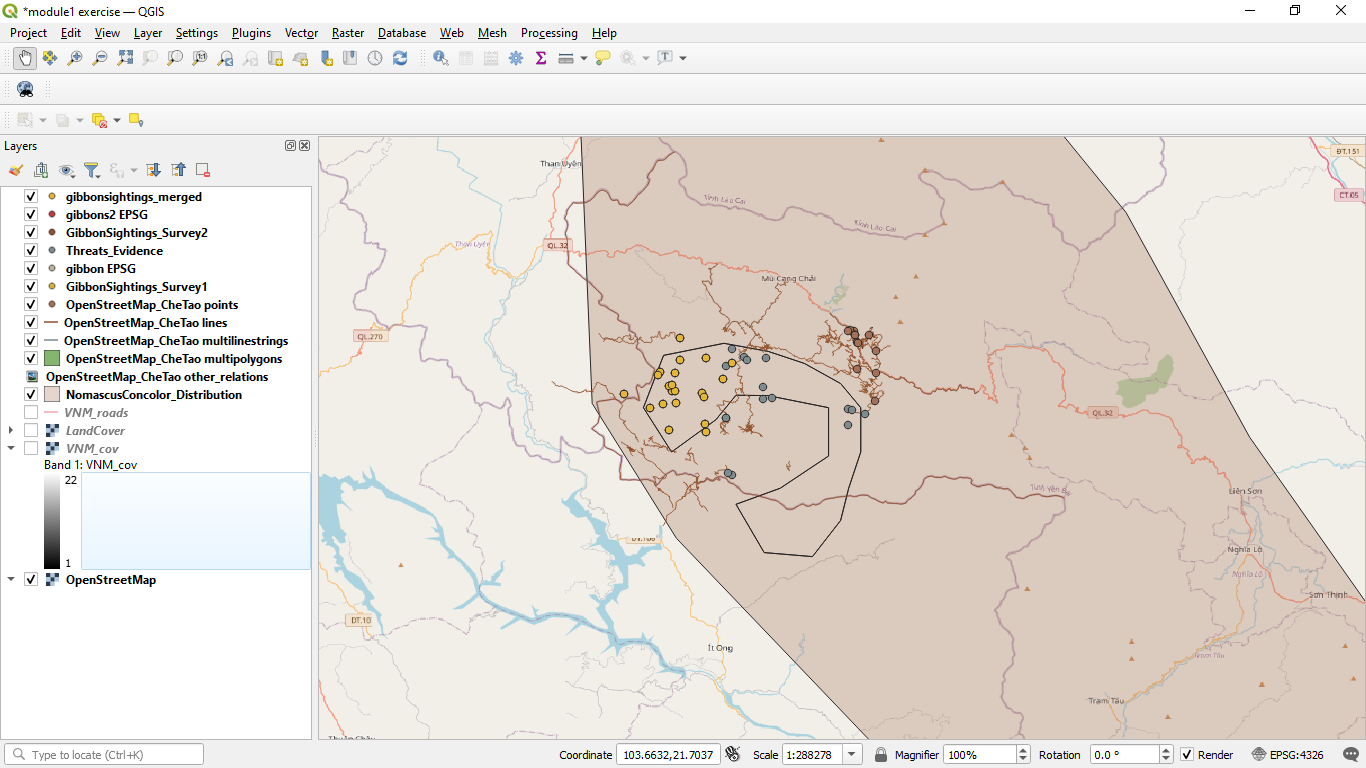
Your Project looks great. I love your choice of colours - the white n purple.
Your Layer panel appears to have too few items compared to mine.
Your Gibbonsightings Merged is turned off. I was expecting to instead see it on and the other two off.
1 Like
Hello everyone
I enjoyed doing this module! This time I understood the instructions, great step forward from my performance on module 2. This what I managed to do.
Hello everyone!
Here’s my work for this week. I found this module very interesting. It was nice to know that it is possible to choose the coordinate system as we add a layer to our work done in QGIS.
Lucy, thanks for the clear instructions.
Sumbele_Anthoine, good job.
Your map is interesting, I liked the way you used the colors and styles to differentiate the points.
Modul 3 was a bit challenging for me. I think I can’t remember if I did it once. I will review it again later.
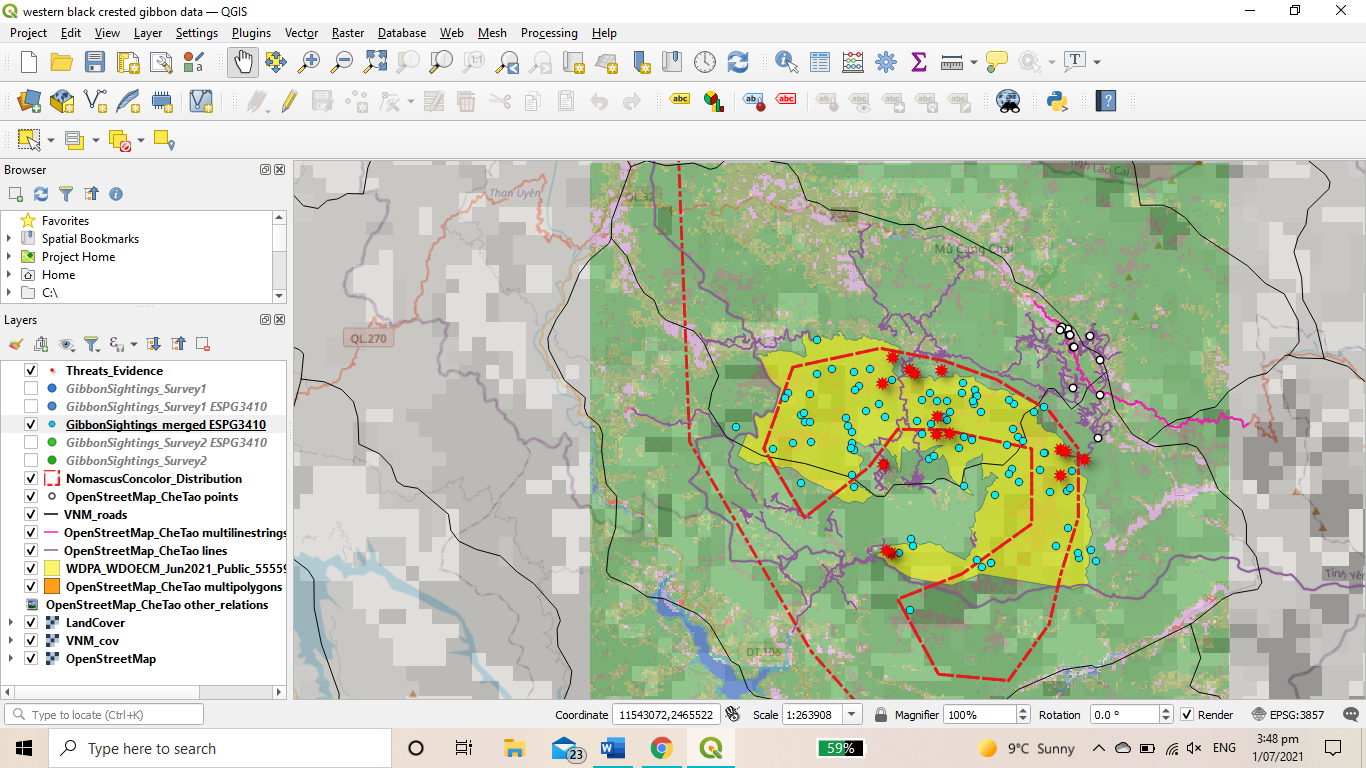
Great to see this!
However, maybe you can switch the merged layer into the first, to see how it looks like when the data merged.
Anyway, I think we are on the same situation  just try to go through first, and hope I can review it later.