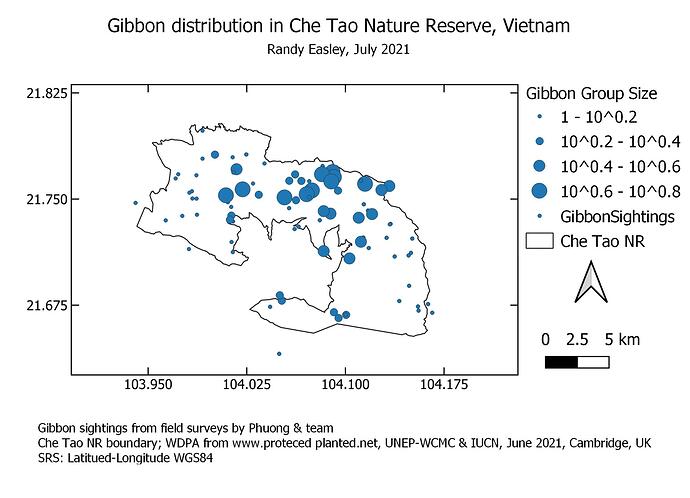
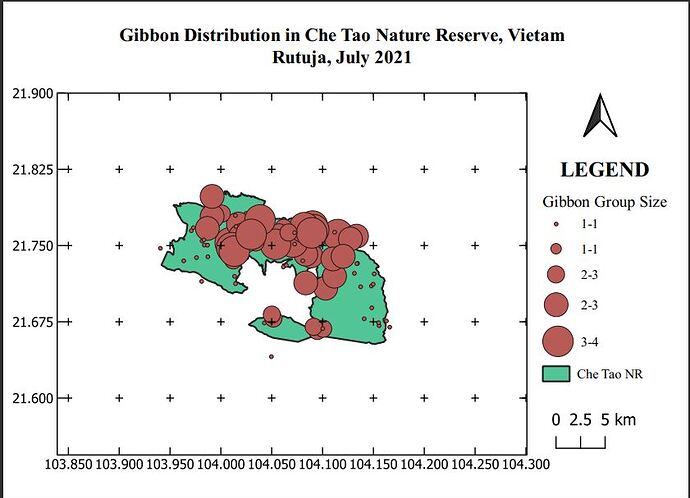
This was a pretty challenging module. It exposed several places where I needed to provide a better way to visualize the information. I had to go back to my original project to include the group size info (I must have missed that somewhere along the way). And I am not particularly happy with the legend, but I will work to correct that. But all in all, I am pretty happy with what I have learned working through the modules and have begun utilizing that knowledge by creating other projects related to my work.
I like that you included both surveys separately. I am wondering if there is a way to include the dates either on the map or in the legend somehow with getting too busy? But good work!
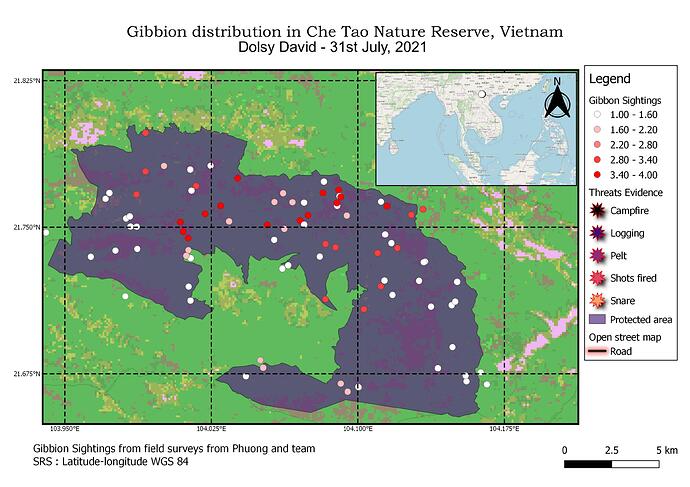
I really like the inset that you used. It is really useful in portraying the project location. I also like that you included both the group size and the threat types. I am wondering if you made the group size symbology more opaque if there were underlying threats we can’t see. Good work!
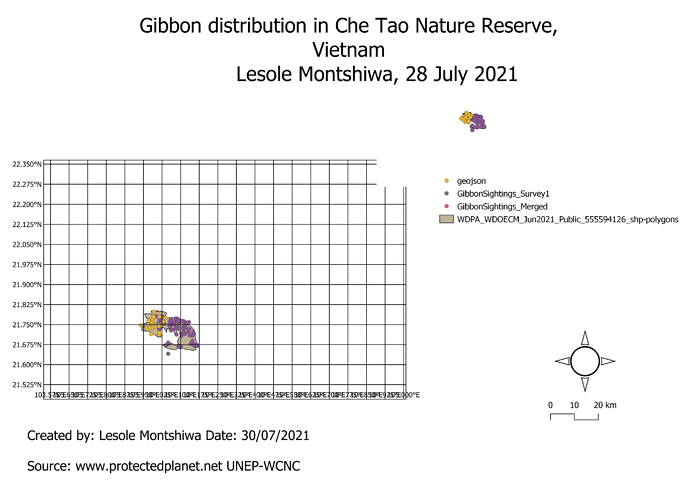
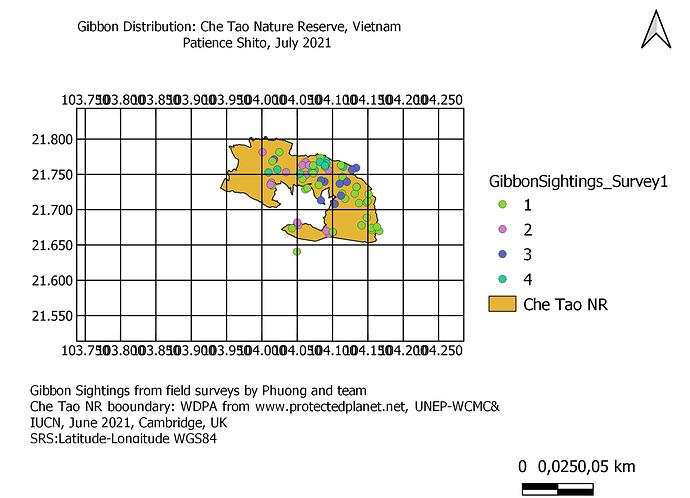
Wao! this module assignment really gave me a hard time but I take I manage at last though not that 100% perfect. At last I took my time and went through the guides slowly. Where i encountered problem is when i tried to enter the interval of Grids, I messed up but eventually I got it right.
My map is showing the Gibbon sightings observed during the survey undertaken within Che tao Nature Reserve.
Waao! excellent work you master this tool. i like you legend very organised and colorisation of points. your inserted map with arrow linking the maps. I take i will also be able to to this in future through practice.
I found this module comparatively easy to do. The explaination was really simple and clear. i had a few difficulties but the reference images helped me. This course has given a real boost to the existing knowledge i had of QGIS.
hey youve done a great job, the map looks pretty good, only suggestion i would give is to arrange your Che tao map in a way to make is more clear. you could increase the size to make the map more understandable. You can do this by using the move content tool on the left hand side. 

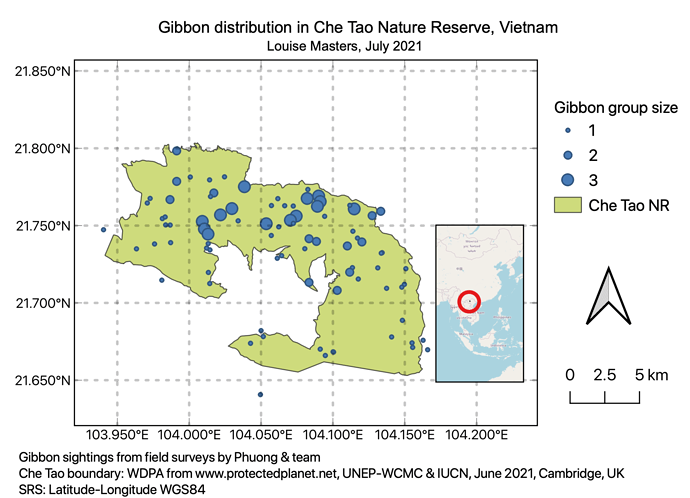
I’m so proud of my map and that I’ve completed this course! I struggled with this final map and there are a few things I’d like to improve but I’m unsure how. I would like to make the Che Tao area larger within the map frame as I think it would make it clearer. I would also like to improve my insert map as the red circle is covering quite a large area. With the legend, I put the group sizes as 1-1.9 and 2-2.9 etc and the legend format as %1 however my ‘4’ group size has dropped off and I can’t get it back. Despite these improvements I feel I have achieved a lot during this course and I feel much more confident using GIS. I am happy with the map I have created. I would be interested in completing another course for example an intermediate course
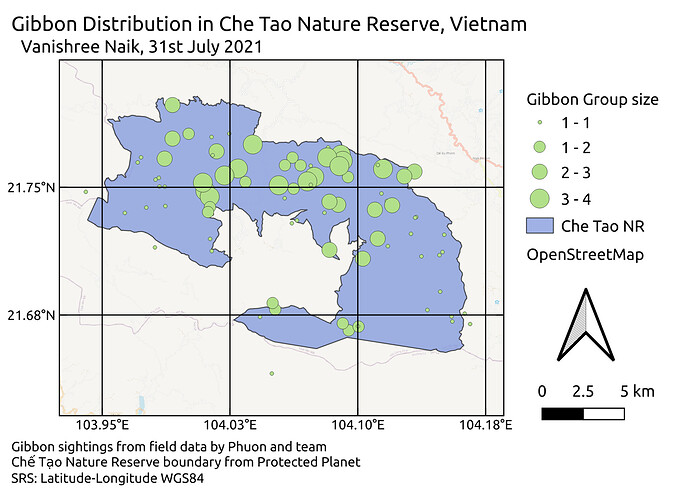
Hi! I think your map looks great and I really like the colours you’ve used. My only suggestion would be to maybe remove the OpenStreetMap layer so you have a white background
Hi all,
Here is my module 4 assignment.
I couldn’t figure out how to add one more layer of a new map.
Hi @LouM
I liked your map, can you please tell me how did you added another layer of open street map.
Thanks & Regards,
Rutuja
and… FINALLY here is my map. it shows the Gibbon sightings as well as threat evidences. hope the inset map is good enough. I am having difficulty in managing between both maps. how do I make changes in only one map? when I uncheck some layers for the inset map, those layers get unchecked for the main map too. I have tried using the lock feature but didn’t quit get the hand of it. so here I wanted to show the threat evidences too on the main map but I unchecked it because it was showing on the inset map too. Then after I saved the map, threats evidence later is not shown on my main map.
Hi @Vani_Naik, I liked the arrangement of your map. You could have added an inset map to better understand the position of the field site in the global context. I liked that you have taken a minimalist approach in making your map which makes it simple to understand. Good job! Congrats for finishing the workshop.
Hi @dolsy_david
I liked your map, just that in your map threats evidence is not plotted as it is mentioned in the legend. I would suggest to hide other groups which have not been plotted.
Thanks & Regards,
Rutuja
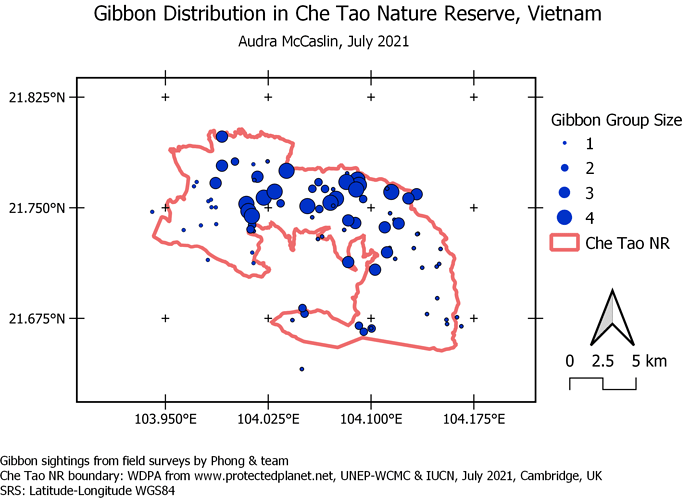
Here is the map that I created for this module. The message of this map is to represent the location and number of gibbon sighed across Che Tao NR. I really enjoyed this module and learning how to make a map tell a story for a specific purpose as that’s key in GIS. I found the directions easy to follow and didn’t have much trouble. I didn’t attempt to add the second map to indicate where the reserve is located in a larger context, but I think that would be beneficial to add if you were publishing this research. I am going to go back and attempt to figure it out.
I think your inset map looks great! It really gives a larger sense of the reserve location to those that are not familiar with Vietnam’s geography or GPS coordinates. I am going to go back to attempt this myself!
Thank you @Rutuja_Bhatade for pointing it out. I will rectify it.
Thank you, Rutuja. I first locked my existing map of the Che Tao reserve in the print layout (in item properties - check lock layers). Then I went back to my project and unticked all the layers except for the Che Tao layer and the Open Street Map layer. I then zoomed out so that the Open Street Map was zoomed out and I could still see where the Che Tao reserve was as a green blob. I then went back to the print layout and clicked the add map tool. I then locked this Open Street Map. I hope that make sense 
well done for persevering! I also struggled a bit. Came up with the same grid as you have!
