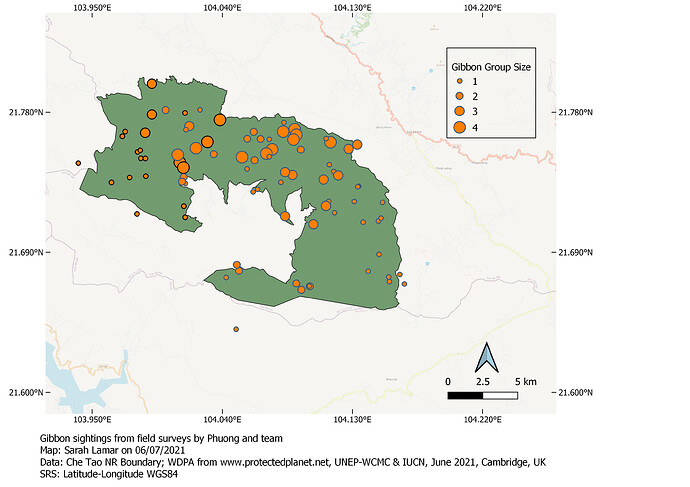
Wow your map looks incredible! How did you make the nested circles in your legend? That is a great way to open up some space and make the map look less cluttered.
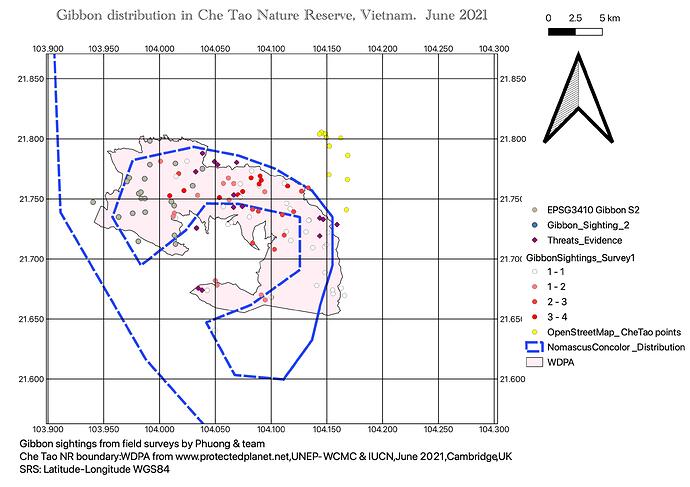
I found this module difficult compared to the others, but this was my attempt at the map and will try to include a second map in the future
This is my final map!
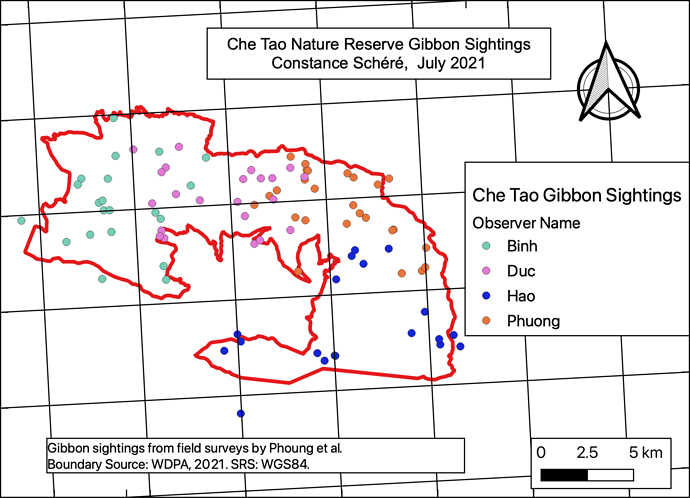
I struggled at first but after going through the instructions several times, I finally managed.
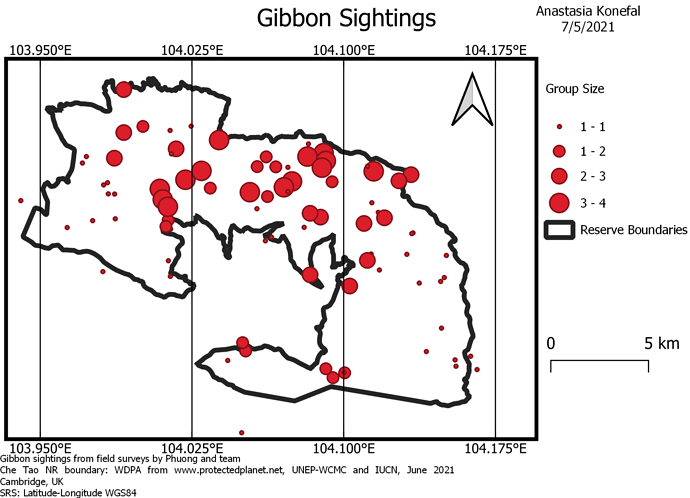
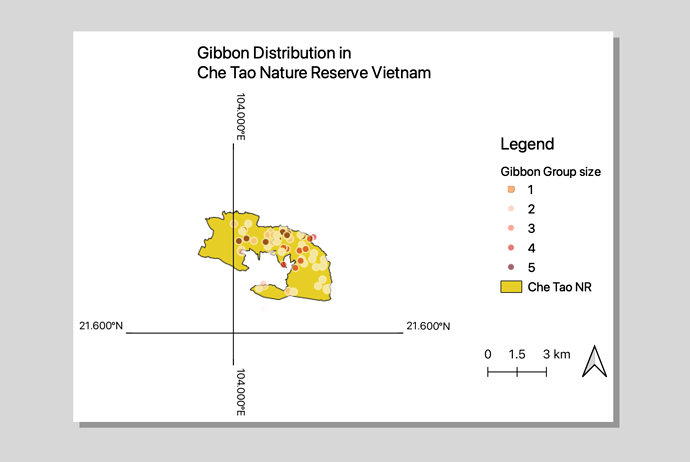
I am showing here Gibbon sightings broken up by group size. This module took me the longest to complete, because I was having a lot of trouble sizing everything and getting the coverage of the map to not cut anything off. I still I could have improved how everything on the map was spaced out to make it visually more appealing.
Hi Jessica ,
Nice map! I like that you added the the inset map to your image as well. I was also struggling with the scale and coverage of my map as well. I ended up manually changing the min and max values for x and y under Item Properties → extent. This was pretty tedious though, so maybe someone else had some insight on an easier way to change that.
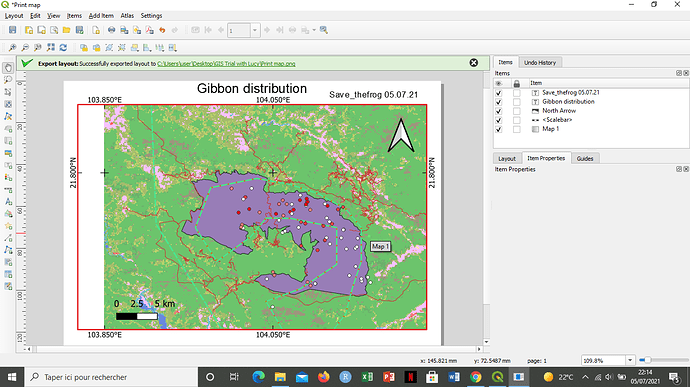
I had a problem with the legend, that’s why I could not show it here. I have lots of layers from the main QGIS, I unchecked them but still appeared on canvas, and the + and - buttons to add or remove layers from the legend was inactivated. But I could not fixed it
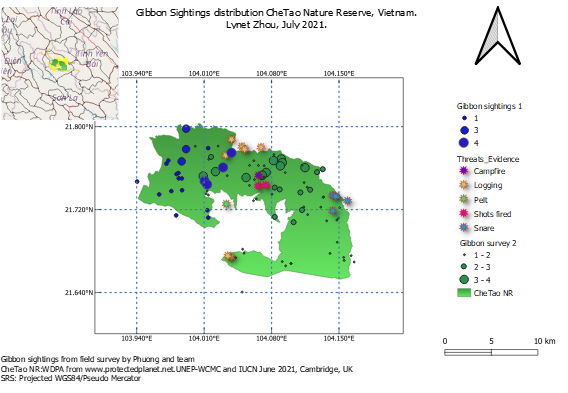
Finally I got it right. I had to adjust vector and raster symbology several times. I am glad that I can now create and export my own map using QGIS, though I think I need more practice. Will keep exploring so that I advance my Skills. Remember to save your work every step of the way, it saves you the trouble of starting your map from scratch. Any input with regards to my map is welcome.
Your map is very clear, great job.
In true sense this module was the gateway to get expertise and confidence in dealing with more critical Map making ahead through the application of QGIS. This module was quite interesting but a bit challenging as well. The most critical and important part in this module according me was selecting the intervals between the grids and learning to adjust/ making changes in the different layers through their individual properties. Thanku so much Lucy for this amazing course, this was truly worth spending my quality time here in learning GIS Mapping through this course.
Amazing work Jess, your map looks very clear and accurate. I really like the way you have used Symbology and Grid interval settings. I have really struggled to make (Insat map), but i can see that how nicely you have done it. Can you please help me out in making Insat map.?
Great map! How’d you get the inset map to work?
I have found a lot of utility in this module. At the beginning I did not imagine the amount of detail that a map has, but it has been very motivating to be able to do it myself following the guide. I have yet to improve my map display, but my work is done for today. Thanks for this course!
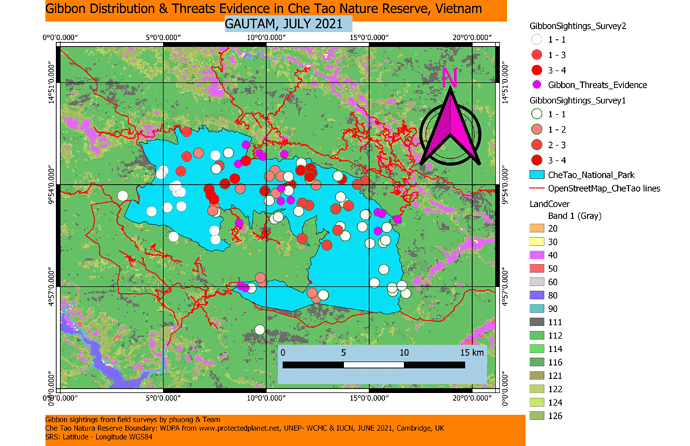
Hello @gautam_wildlife I see that you have included all the information you have. 
Perhaps it would be better to remove some layers to focus attention on the important ones. Anyways it´s a very complete work. 
Here is my map for this week’s lesson. I tried modifying the grid a bit and somehow ended up with this. I see that others have different grid projections as well. I’m not sure if I’ll use this particular grid function again, but I like that there is a variety of grids functions to choose from. Great lesson overall!
Hi, I like your map and choice of colors.
Wow! This was a helpful module. This is the map I made as I worked through the module. I will be going back to edit and play around - I want to try to add an inset. This module was a huge help and I feel really grateful for this course!
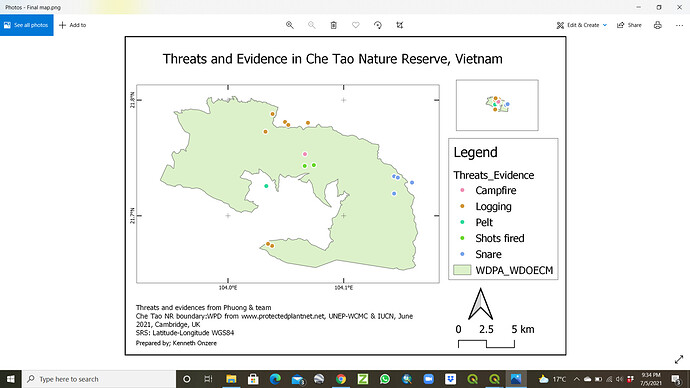
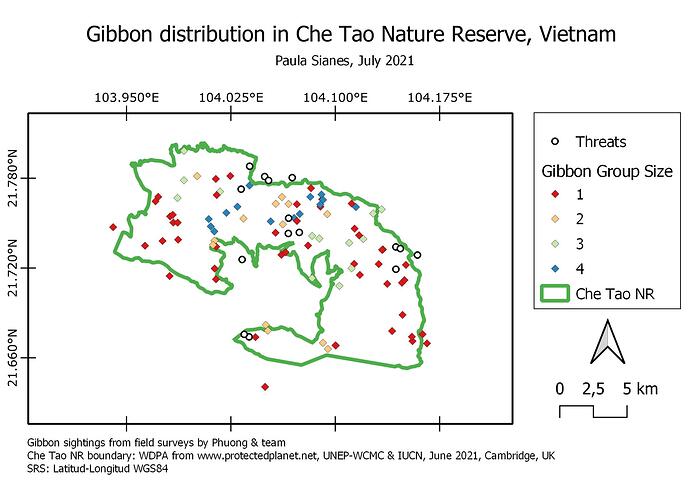
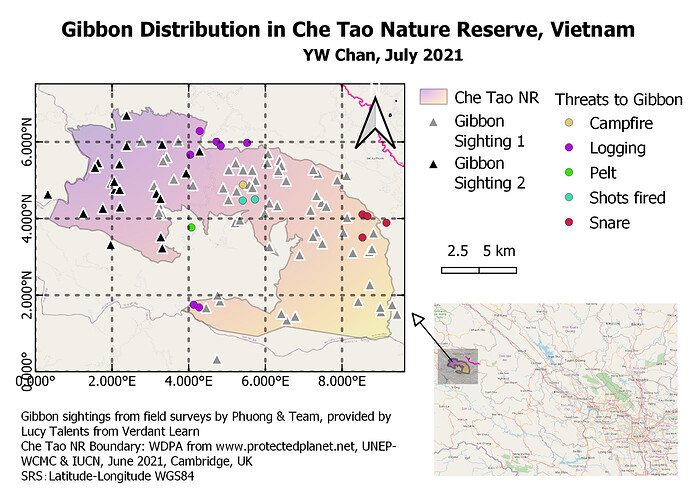
I like how you added your title over the top and also showed threats on the map! Do you think you would consider color blind friendly colors in the future? Overall, amazing work!
I loved how this module tied everything we have learned so far together. It was tricky figuring out how to best align and present the maps including the legends, title etc. Through the data points which I have chosen to show in my map, I hope to provide the viewer with context of where the study site is in relation to Vietnam’s popular destination of Han Noi. Secondly, I also hope to show how the Gibbon sightings are more concentrated in areas with less threatening activities.
Hi Jonathan!
I love the originality of your product, from using your own data to the presentation layout! I guess one thing which could add to your map would be a visual scale so one can visualize the size of the area (even though it is already stated in numeric form).
Amazing, great work!
